


Prometheus监控进程
process-export主要用来做进程监控,比如某个服务的进程数、消耗了多少CPU、内存等资源。
process-exporter安装
1、下载 process-exporter
2、配置 process-exporter
tar -zxvf process-exporter-0.7.5.linux-amd64.tar.gz
mv process-exporter-0.7.5.linux-amd64 /usr/local/process-exporter
3、添加监控配置文件
vim /usr/local/process-exporter/process_exporter.yaml #存放脚本的地方

process_names:
#  - name: "{{.Comm}}"
#    cmdline:
#    - '.+'

  - name: "{{.Matches}}"
    cmdline:
    - 'nginx' #唯一标识

  - name: "{{.Matches}}"
    cmdline:
    - '/opt/atlassian/confluence/bin/tomcat-juli.jar'

  - name: "{{.Matches}}"
    cmdline:
    - 'mysqld'

  - name: "{{.Matches}}"
    cmdline:
    - 'redis-server'
示例:
cmdline: 所选进程的唯一标识,ps -ef 可以查询到。如果改进程不存在,则不会有该进程的数据采集到。
例如:> ps -ef | grep redis
redis 4287 4127 0 Oct31 ? 00:58:12 redis-server *:6379
| {{.Comm}} | groupname=”redis-server” | exe或者sh文件名称 |
|---|---|---|
| {{.ExeBase}} | groupname=”redis-server *:6379” | / |
| {{.ExeFull}} | groupname=”/usr/bin/redis-server *:6379” | ps中的进程完成信息 |
| {{.Username}} | groupname=”redis” | 使用进程所属的用户进行分组 |
| {{.Matches}} | groupname=”map[:redis]” | 表示配置到关键字“redis” |
4、使用systemctl管理process-exporter进程
vim /usr/lib/systemd/system/process_exporter.service

[Unit]
Description=Prometheus exporter for processors metrics, written in Go with pluggable metric collectors.
Documentation=https://github.com/ncabatoff/process-exporter
After=network.target

[Service]
Type=simple
User=prometheus
WorkingDirectory=/usr/local/process-exporter
ExecStart=/usr/local/process-exporter/process-exporter -config.path=/usr/local/process-exporter/process-exporter.yaml
Restart=on-failure

[Install]
WantedBy=multi-user.target
5、配置开机启动process-exporter
systemctl enable process-exporter --now
systemctl status process-exporter

● process_exporter.service - Prometheus exporter for processors metrics, written in Go with pluggable metric collectors.
   Loaded: loaded (/usr/lib/systemd/system/process_exporter.service; enabled; vendor preset: disabled)
   Active: active (running) since Thu 2023-05-11 09:27:15 CST; 1h 53min ago
     Docs: https://github.com/ncabatoff/process-exporter
 Main PID: 3601 (process-exporte)
    Tasks: 20
   Memory: 9.6M
   CGroup: /system.slice/process_exporter.service
           └─3601 /usr/local/process-exporter/process-exporter -config.path=/usr/local/process-exporter/process-exporter.yaml

May 11 09:27:15 iZ2zegyhr62d4cf14c3v28Z systemd[1]: Started Prometheus exporter for processors metrics, written in Go with pluggable metric collectors..
May 11 09:27:15 iZ2zegyhr62d4cf14c3v28Z process-exporter[3601]: 2023/05/11 09:27:15 Reading metrics from /proc based on "/usr/local/process-exporter/p...r.yaml"
May 11 09:27:16 iZ2zegyhr62d4cf14c3v28Z process-exporter[3601]: level=info ts=2023-05-11T01:27:16.137Z caller=tls_config.go:195 msg="TLS is disabled."...2=false
Hint: Some lines were ellipsized, use -l to show in full.
验证监控数据
curl http://localhost:9256/metrics
#相关测试的数据
# HELP http_response_size_bytes The HTTP response sizes in bytes.
# TYPE http_response_size_bytes summary
http_response_size_bytes{handler="prometheus",quantile="0.5"} 2988
http_response_size_bytes{handler="prometheus",quantile="0.9"} 2996
http_response_size_bytes{handler="prometheus",quantile="0.99"} 3006
http_response_size_bytes_sum{handler="prometheus"} 1.34205181e+08
http_response_size_bytes_count{handler="prometheus"} 45188
# HELP namedprocess_namegroup_context_switches_total Context switches
# TYPE namedprocess_namegroup_context_switches_total counter
namedprocess_namegroup_context_switches_total{ctxswitchtype="nonvoluntary",groupname="map[:bladebit]"} 7.7977455e+07
namedprocess_namegroup_context_switches_total{ctxswitchtype="nonvoluntary",groupname="map[:pw_python.py]"} 2.02666e+06
namedprocess_namegroup_context_switches_total{ctxswitchtype="voluntary",groupname="map[:bladebit]"} 3.335109e+06
namedprocess_namegroup_context_switches_total{ctxswitchtype="voluntary",groupname="map[:pw_python.py]"} 8.22652233e+08
# HELP namedprocess_namegroup_cpu_system_seconds_total Cpu system usage in seconds
# TYPE namedprocess_namegroup_cpu_system_seconds_total counter
namedprocess_namegroup_cpu_system_seconds_total{groupname="map[:bladebit]"} 94275.01000000017
namedprocess_namegroup_cpu_system_seconds_total{groupname="map[:pw_python.py]"} 64818.93000000004
# HELP namedprocess_namegroup_cpu_user_seconds_total Cpu user usage in seconds
# TYPE namedprocess_namegroup_cpu_user_seconds_total counter
namedprocess_namegroup_cpu_user_seconds_total{groupname="map[:bladebit]"} 2.42621264299998e+07
namedprocess_namegroup_cpu_user_seconds_total{groupname="map[:pw_python.py]"} 85.29000000000613
# HELP namedprocess_namegroup_major_page_faults_total Major page faults
# TYPE namedprocess_namegroup_major_page_faults_total counter
namedprocess_namegroup_major_page_faults_total{groupname="map[:bladebit]"} 18261
namedprocess_namegroup_major_page_faults_total{groupname="map[:pw_python.py]"} 1236
# HELP namedprocess_namegroup_memory_bytes number of bytes of memory in use
# TYPE namedprocess_namegroup_memory_bytes gauge
namedprocess_namegroup_memory_bytes{groupname="map[:bladebit]",memtype="resident"} 4.46810939392e+11
namedprocess_namegroup_memory_bytes{groupname="map[:bladebit]",memtype="swapped"} 0
namedprocess_namegroup_memory_bytes{groupname="map[:bladebit]",memtype="virtual"} 4.47847292928e+11
namedprocess_namegroup_memory_bytes{groupname="map[:pw_python.py]",memtype="resident"} 1.2959744e+07
namedprocess_namegroup_memory_bytes{groupname="map[:pw_python.py]",memtype="swapped"} 0
namedprocess_namegroup_memory_bytes{groupname="map[:pw_python.py]",memtype="virtual"} 2.4733696e+08
prometheus 配置添加监控
  - job_name: "process_exporter"
    static_configs:
      - targets: ["172.17.224.16:9256"]
配置alertmanagers告警rules
之前请先配置好alertmanagers告警 不会点这里
1、prometheus配置文件里确定rules目录:
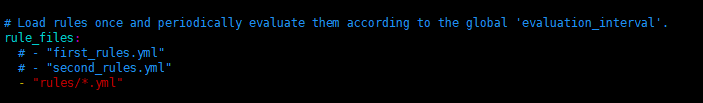
2、新建告警规则:
vim ./rules/process_exporter.yml
groups:
- name: 进程监控
  rules:
  - alert: redis进程退出告警
    expr: namedprocess_namegroup_num_procs{groupname="map[:redis-server]"} < 1
    for: 1m
    labels:
      severity: warning
    annotations:
      summary: "{{ $labels.instance }}: redis进程退出"
      description: "{{ $labels.instance }}: redis服务挂掉,已经超过1m,请尽快查看。"
      value: "{{ $value }}"

  - alert: mysql进程退出告警
    expr: namedprocess_namegroup_num_procs{groupname="map[:mysqld]"} < 1
    for: 30s
    labels:
      severity: warning
    annotations:
      summary: "{{ $labels.instance }}: mysql进程退出"
      description: "{{ $labels.instance }}: mysql服务挂掉,已经超过30S,请尽快查看。"
      value: "{{ $value }}"

  - alert: confluence后台退出告警
    expr: namedprocess_namegroup_num_procs{groupname="map[:/opt/atlassian/confluence/bin/tomcat-juli.jar]"} < 1
    for: 1m
    labels:
      severity: warning
    annotations:
      summary: "{{ $labels.instance }}: confluence退出"
      description: "{{ $labels.instance }}: confluence挂掉,已经超过1m,请尽快查看。"
      value: "{{ $value }}"
重启prometheus服务
systemctl restart prometheus
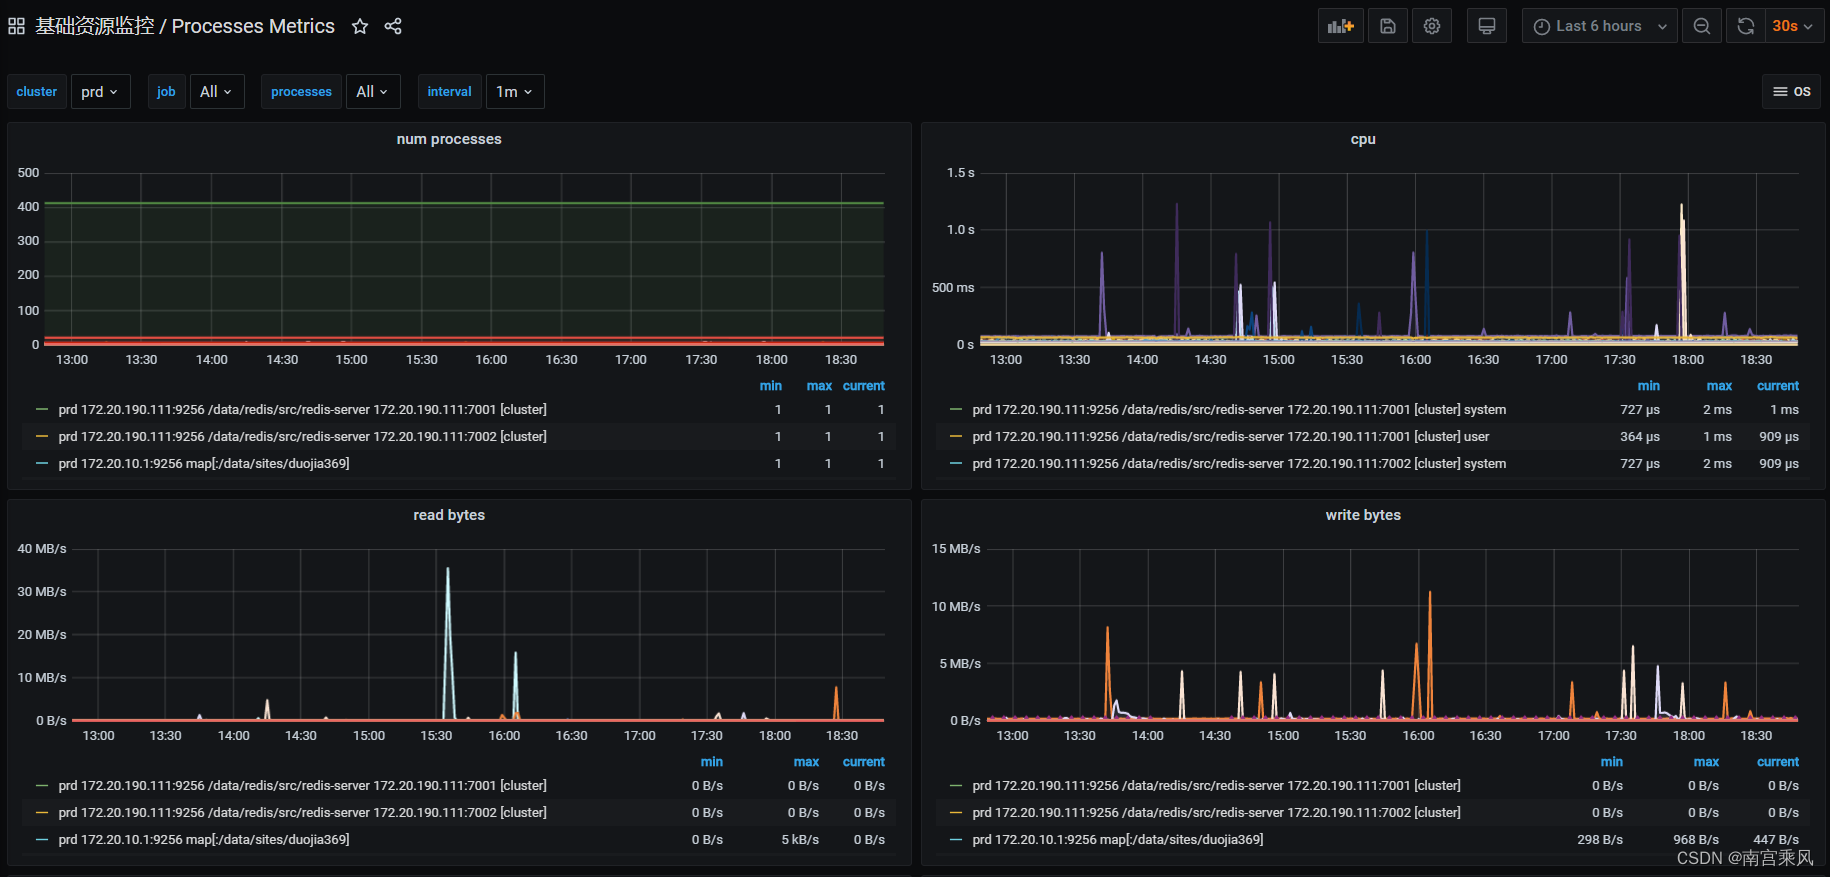
grafana出图
process-exporter对应dashboard 的ID为:249
效果如下
评论区