


Alertmanager 部署和配置
在 Prometheus 生态架构中,告警是由独立的两部分组成,可以通过下图来了解我们 Prometheus 告警机制。
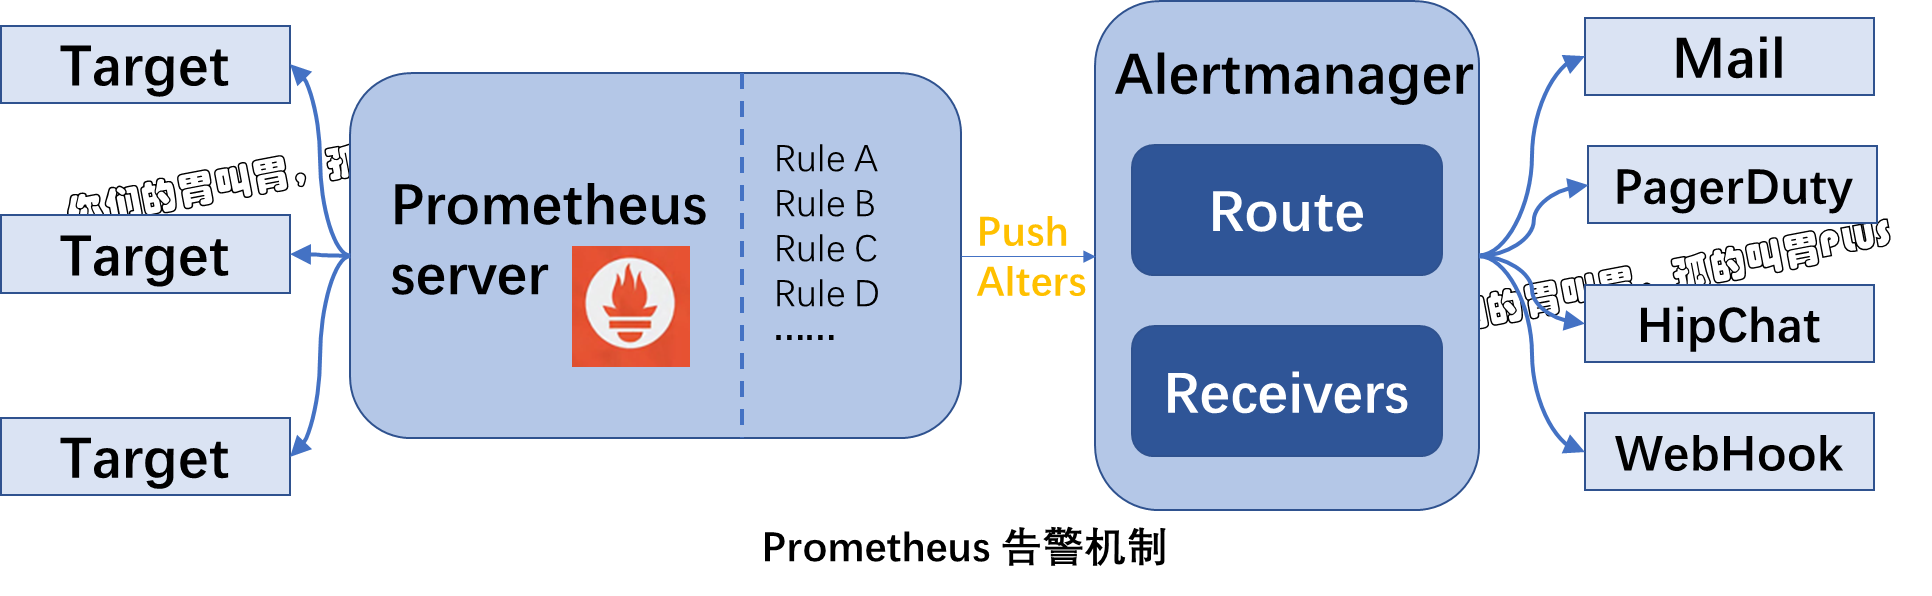
其中 Prometheus server 与 Alertmanager 是相互分离的两个组件。
我们使用 Prometheus server 采集各类监控指标,然后基于 PromQL 对这些指标定义阈值告警规则(Rules)。Prometheus server 对告警规则周期性地进行计算,如果满足告警触发条件,便生成一条告警信息,并将其推送到 Alertmanager 组件。收到告警信息后,Alertmanager 会处理告警,进行分组(grouping)并将它们路由(routing)到正确的接收器(receiver),如 Email、pagerduty 和 Hipchat 等,最终把异常事件的通知发送给接收者。
在 Prometheus 中,我们不仅可以对一条告警规则进行命名并通过 PromQL 定义规则,更多时候是对相关的告警进行分组后统一定义。下面我们先对 AlertManager 中告警的分组(Grouping)、抑制(Inhibition)和静默(Sliences)介绍。
一、概念介绍
1.1、告警分组
分组机制(Grouping)是指,AlertManager 将同类型的告警进行分组,合并多条告警到一个通知中。在实际环境中,特别是云计算环境中的业务场景之间密集耦合时,弱出现多台设备宕机,可能会导致成百上千个告警被触发。在这种情况下使用分组机制,可以将这些被触发的告警合并为一个告警进行通知,从而避免瞬间突发性地接收大量的告警通知,使得管理员无法对问题进行快速定位。
1.2、告警抑制
Alertmanager 的抑制机制(Inhibition)是指,当某告警已经发出,停止重复发送由此告警引发的其他异常或故障的告警机制。在生产环境中,例如 IDC 托管机柜中,若每个机制接入层仅仅是单台交换机,那么该机柜接入交换机故障会造成机柜中服务器非 UP状态告警;再有服务器上部署的应用不可发昂文也会触发告警。此时,可以配置 Alertmanger 忽略由交换机故障造成的机柜所有服务器及其应用不可访问而产生的告警。
1.3、告警静默
告警静默(Silences)提供了一个简单的机制,可以根据标签快速对告警进行静默处理。对传入的告警进行匹配检查,如果接收到的告警符合静默的配置,Alertmanager 则不会发送告警通知。管理员可以直接在 Alertmanager 的 Web 界面中临时屏蔽
静默操作:
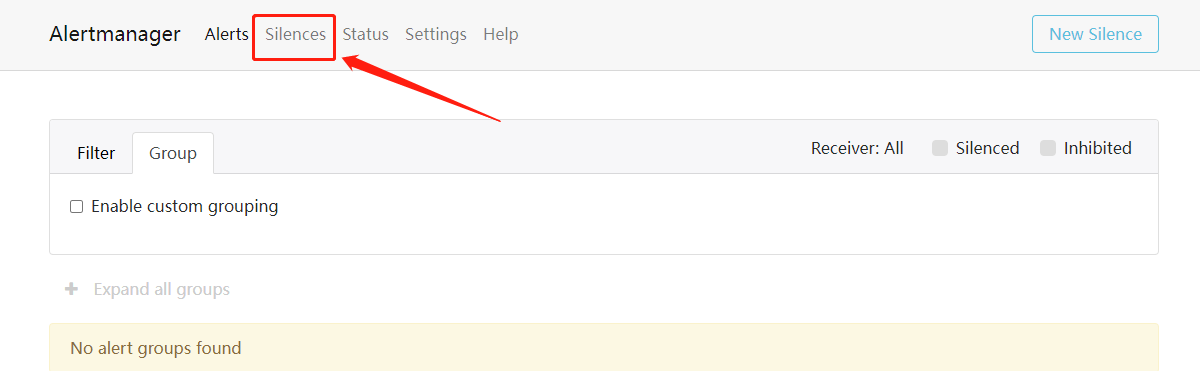
1.3.1: 访问 Web 端
http://localhost:9093/
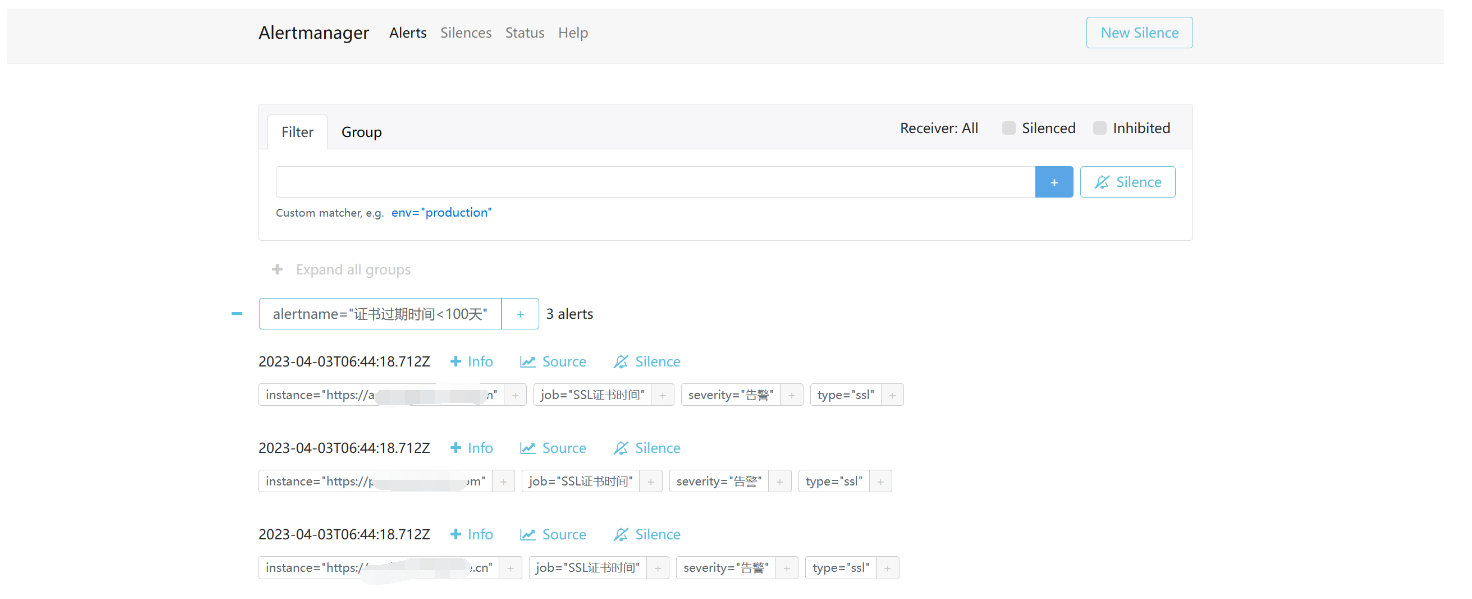
从上图可以看到目前有三条告警信息正在正效状态。
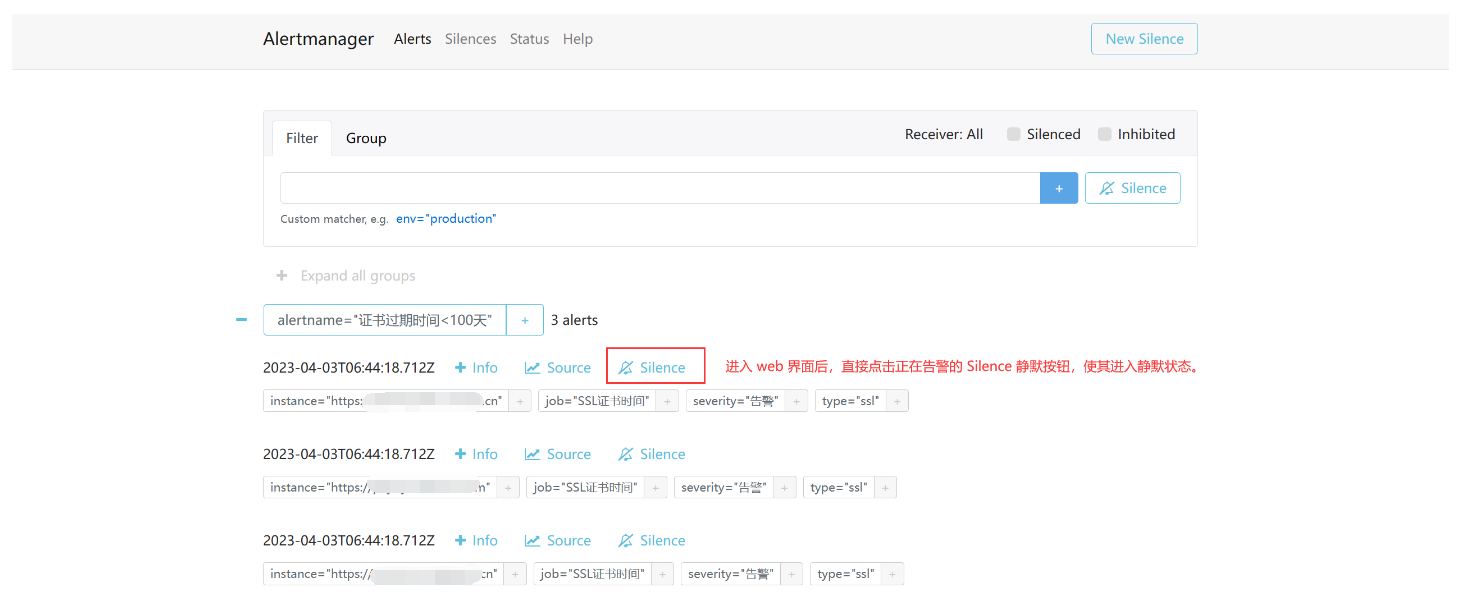
1.3.2:根据现有的告警设置静默
- 直接点击 Silence 静默
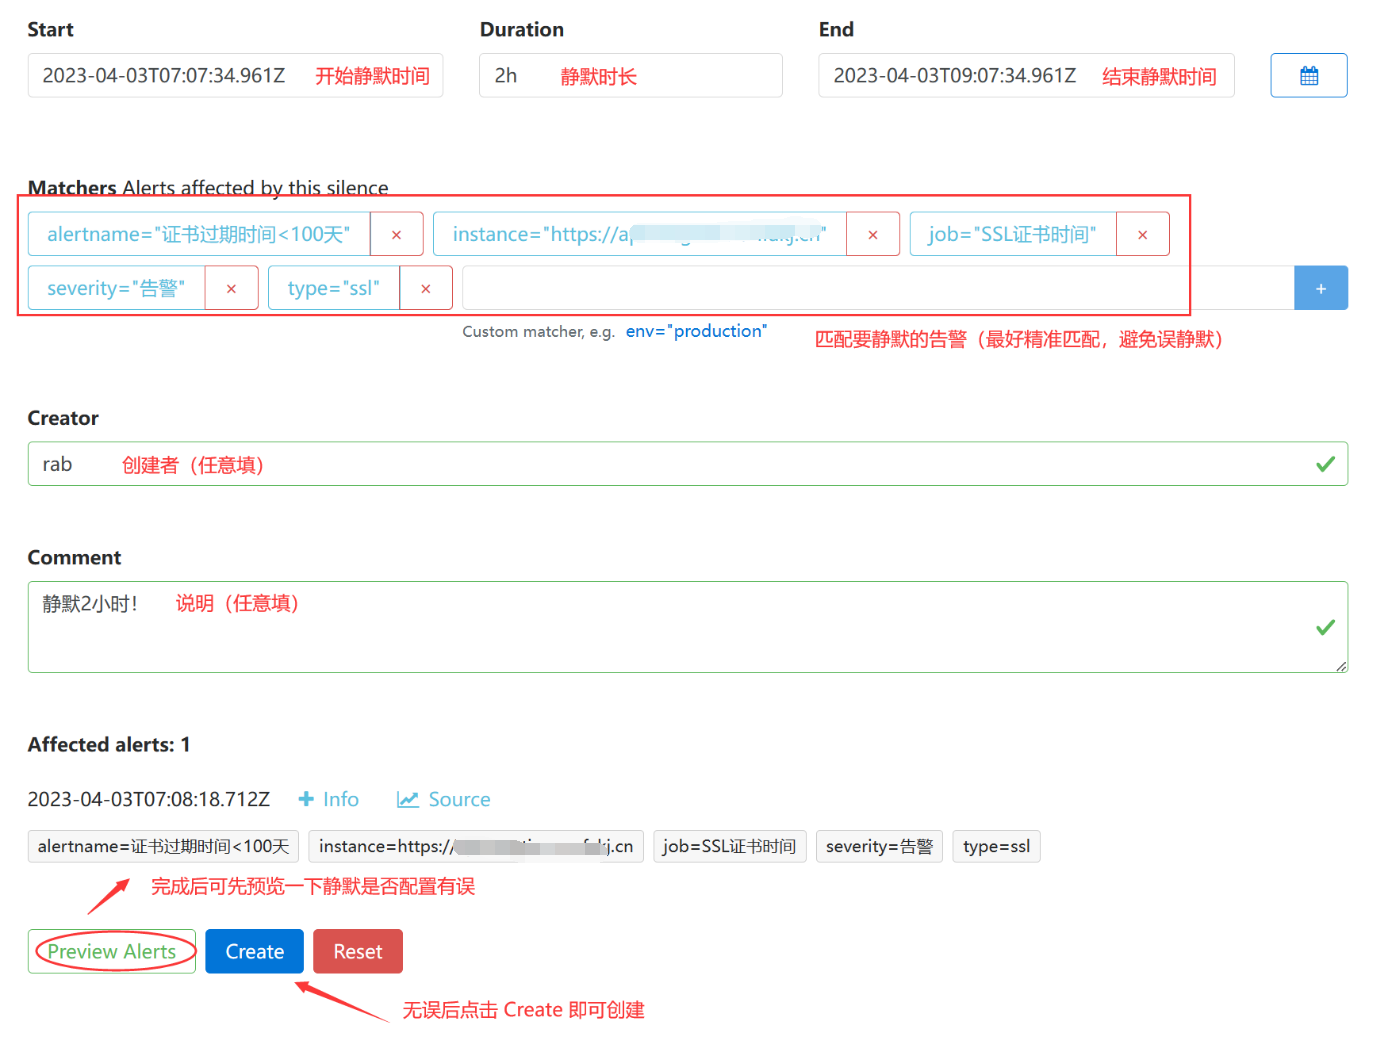
- 开始静默设置
- 最后再看看告警
已经没有刚才配置了静默的告警了。
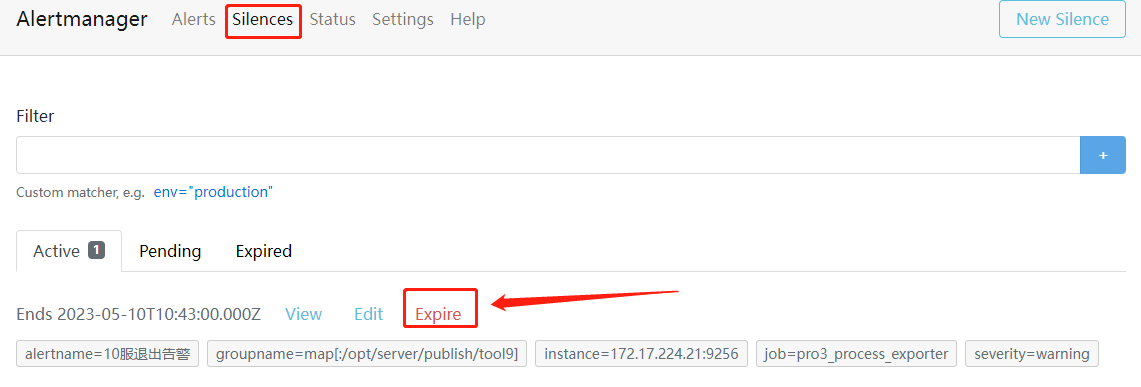
恢复告警(解除静默):
1.4.1: 访问 Web 端
1.4.2: 选择要恢复的规则
1.4.3: 最后点击 Confirm
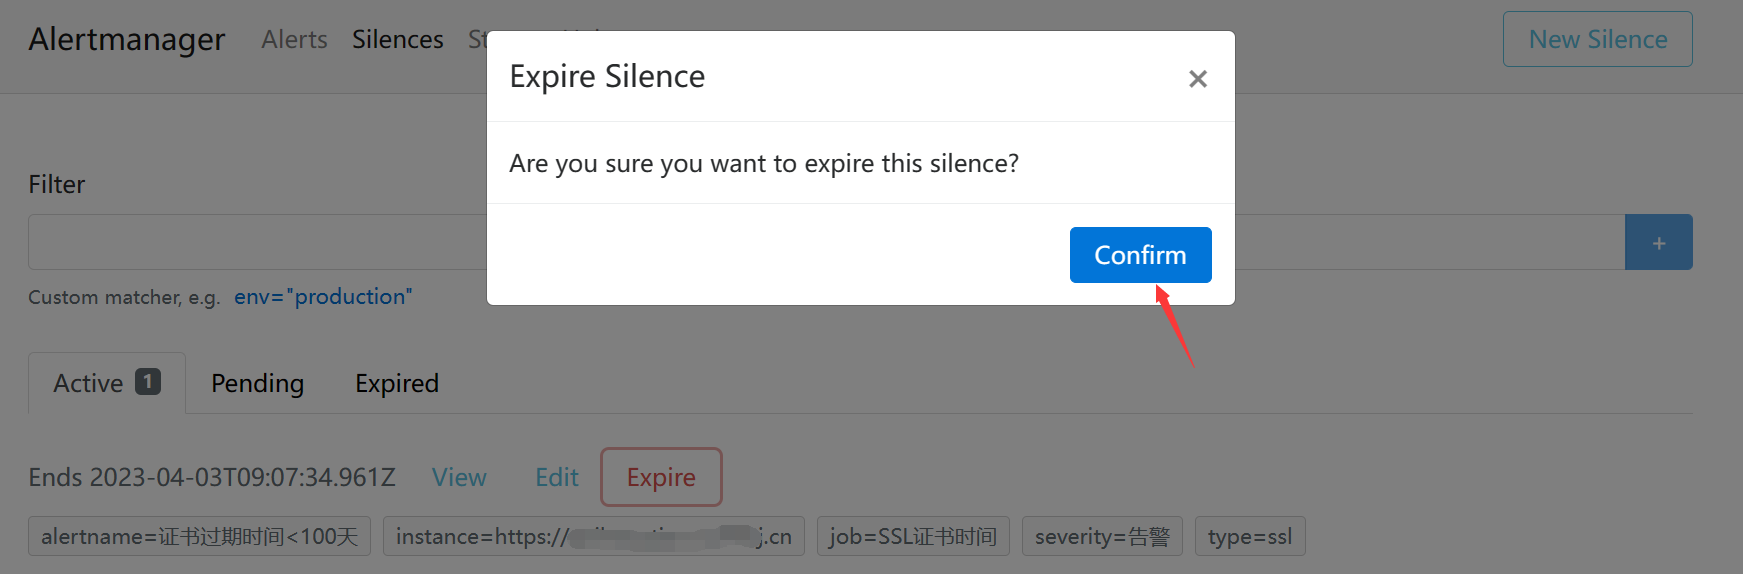
- 最后再看看告警
告警已经恢复。
二、部署安装
2.1、使用二进制部署安装
github 下载地址:https://github.com/prometheus/alertmanager
Alertmanager 官网下载地址:https://prometheus.io/download/
因为 Alertmanager 也是基于 Go 语言编写而成,因此 可以直接使用官方提供的二进制软件安装包,解压缩后快速安装
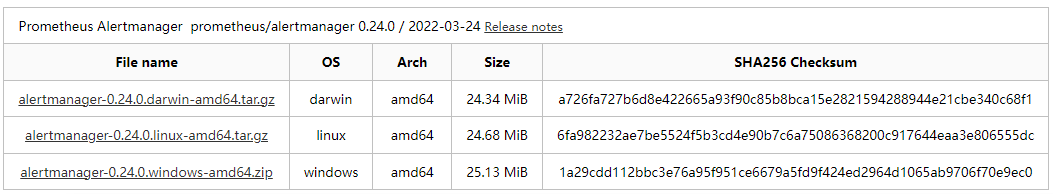
2.1.1 官方下载 Alertmanager 完成后,获取软件包的哈希值
[root@iZj6cdj8nbj0zla2lnq2g9Z zy]# wget https://github.com/prometheus/alertmanager/releases/download/v0.24.0/alertmanager-0.24.0.linux-amd64.tar.gz
--2022-08-01 20:14:49--  http://wget/
Resolving wget (wget)... failed: Name or service not known.
wget: unable to resolve host address ‘wget’
--2022-08-01 20:14:49--  https://github.com/prometheus/alertmanager/releases/download/v0.24.0/alertmanager-0.24.0.linux-amd64.tar.gz
Resolving github.com (github.com)... 20.205.243.166
Connecting to github.com (github.com)|20.205.243.166|:443... connected.
HTTP request sent, awaiting response... 302 Found
Location: https://objects.githubusercontent.com/github-production-release-asset-2e65be/11452538/d3143d23-5eab-4248-ae7b-2d04eb2e6084?X-Amz-Algorithm=AWS4-HMAC-SHA256&X-Amz-Credential=AKIAIWNJYAX4CSVEH53A%2F20220801%2Fus-east-1%2Fs3%2Faws4_request&X-Amz-Date=20220801T121430Z&X-Amz-Expires=300&X-Amz-Signature=7d06247b82eb679c427703cda2f31b6ca64b76806dcbb09fd297af880e842f83&X-Amz-SignedHeaders=host&actor_id=0&key_id=0&repo_id=11452538&response-content-disposition=attachment%3B%20filename%3Dalertmanager-0.24.0.linux-amd64.tar.gz&response-content-type=application%2Foctet-stream [following]
--2022-08-01 20:14:50--  https://objects.githubusercontent.com/github-production-release-asset-2e65be/11452538/d3143d23-5eab-4248-ae7b-2d04eb2e6084?X-Amz-Algorithm=AWS4-HMAC-SHA256&X-Amz-Credential=AKIAIWNJYAX4CSVEH53A%2F20220801%2Fus-east-1%2Fs3%2Faws4_request&X-Amz-Date=20220801T121430Z&X-Amz-Expires=300&X-Amz-Signature=7d06247b82eb679c427703cda2f31b6ca64b76806dcbb09fd297af880e842f83&X-Amz-SignedHeaders=host&actor_id=0&key_id=0&repo_id=11452538&response-content-disposition=attachment%3B%20filename%3Dalertmanager-0.24.0.linux-amd64.tar.gz&response-content-type=application%2Foctet-stream
Resolving objects.githubusercontent.com (objects.githubusercontent.com)... 185.199.109.133, 185.199.110.133, 185.199.111.133, ...
Connecting to objects.githubusercontent.com (objects.githubusercontent.com)|185.199.109.133|:443... connected.
HTTP request sent, awaiting response... 200 OK
Length: 25880024 (25M) [application/octet-stream]
Saving to: ‘alertmanager-0.24.0.linux-amd64.tar.gz’

100%[============================================================================>] 25,880,024  4.02MB/s   in 6.5s

2022-08-01 20:14:56 (3.82 MB/s) - ‘alertmanager-0.24.0.linux-amd64.tar.gz’ saved [25880024/25880024]

FINISHED --2022-08-01 20:14:56--
Total wall clock time: 7.1s
Downloaded: 1 files, 25M in 6.5s (3.82 MB/s)
[root@iZj6cdj8nbj0zla2lnq2g9Z zy]# sha256sum alertmanager-0.24.0.linux-amd64.tar.gz
6fa982232ae7be5524f5b3cd4e90b7c6a75086368200c917644eaa3e806555dc  alertmanager-0.24.0.linux-amd64.tar.gz
2.1.2解压缩软件包都指定的安装目录
[root@iZj6cdj8nbj0zla2lnq2g9Z zy]# tar -zxvf alertmanager-0.24.0.linux-amd64.tar.gz
alertmanager-0.24.0.linux-amd64/
alertmanager-0.24.0.linux-amd64/alertmanager.yml
alertmanager-0.24.0.linux-amd64/LICENSE
alertmanager-0.24.0.linux-amd64/NOTICE
alertmanager-0.24.0.linux-amd64/alertmanager
alertmanager-0.24.0.linux-amd64/amtool
[root@iZj6cdj8nbj0zla2lnq2g9Z zy]# mkdir -pv /usr/local/alertmanager/release/
mkdir: created directory ‘/usr/local/alertmanager’
mkdir: created directory ‘/usr/local/alertmanager/release/’
[root@iZj6cdj8nbj0zla2lnq2g9Z zy]# mv alertmanager-0.24.0.linux-amd64 /usr/local/alertmanager/release/
[root@iZj6cdj8nbj0zla2lnq2g9Z zy]# cd /usr/local/alertmanager/
[root@iZj6cdj8nbj0zla2lnq2g9Z alertmanager]# ls -l
total 4
drwxr-xr-x 3 root root 4096 Aug  1 20:19 release
[root@iZj6cdj8nbj0zla2lnq2g9Z alertmanager]# ln -nsvf release/alertmanager-0.24.0.linux-amd64 current
‘current’ -> ‘release/alertmanager-0.24.0.linux-amd64’
[root@iZj6cdj8nbj0zla2lnq2g9Z alertmanager]# tree .
.
├── current -> release/alertmanager-0.24.0.linux-amd64
└── release
    └── alertmanager-0.24.0.linux-amd64
        ├── alertmanager
        ├── alertmanager.yml
        ├── amtool
        ├── LICENSE
        └── NOTICE

3 directories, 5 files
2.1.3 添加 alertmanager 为系统服务开机启动
[Unit]
Description=AlertManager Server Service daemon
Wants=network-online.target
After=network-online.target

[Service]
User=root
Group=root
Type=Simple
Restart=on-failure
ExecStart=/usr/local/alertmanager/current/alertmanager \
    --config.file "/usr/local/alertmanager/current/alertmanager.yml" \
    --storage.path="/usr/local/alertmanager/current/data" \
    --data.retention=120h \
    --alerts.gc-interval=30m \
    --web.external-url "http://192.168.2.2.121:9093"
    --web.listen-address=":9093"

[Install]
WantedBy=multi-user.target
2.1.4 启动服务
[root@iZj6cdj8nbj0zla2lnq2g9Z current]# systemctl daemon-reload
[root@iZj6cdj8nbj0zla2lnq2g9Z current]# systemctl enable alertmanager.service
Created symlink from /etc/systemd/system/multi-user.target.wants/alertmanager.service to /usr/lib/systemd/system/alertmanager.service.
[root@iZj6cdj8nbj0zla2lnq2g9Z current]# systemctl start alertmanager.service
[root@iZj6cdj8nbj0zla2lnq2g9Z current]# systemctl status alertmanager.service
● alertmanager.service - AlertManager Server Service daemon
   Loaded: loaded (/usr/lib/systemd/system/alertmanager.service; enabled; vendor preset: disabled)
   Active: active (running) since Mon 2022-08-01 20:30:17 CST; 6s ago
 Main PID: 24760 (alertmanager)
    Tasks: 7
   Memory: 13.4M
   CGroup: /system.slice/alertmanager.service
           └─24760 /usr/local/alertmanager/current/alertmanager --config.file /usr/lo...

Aug 01 20:30:17 iZj6cdj8nbj0zla2lnq2g9Z systemd[1]: Started AlertManager Server Serv....
Aug 01 20:30:17 iZj6cdj8nbj0zla2lnq2g9Z alertmanager[24760]: ts=2022-08-01T12:30:17.9...
Aug 01 20:30:17 iZj6cdj8nbj0zla2lnq2g9Z alertmanager[24760]: ts=2022-08-01T12:30:17.9...
Aug 01 20:30:17 iZj6cdj8nbj0zla2lnq2g9Z alertmanager[24760]: ts=2022-08-01T12:30:17.9...
Aug 01 20:30:17 iZj6cdj8nbj0zla2lnq2g9Z alertmanager[24760]: ts=2022-08-01T12:30:17.9...
Aug 01 20:30:17 iZj6cdj8nbj0zla2lnq2g9Z alertmanager[24760]: ts=2022-08-01T12:30:17.9...
Aug 01 20:30:17 iZj6cdj8nbj0zla2lnq2g9Z alertmanager[24760]: ts=2022-08-01T12:30:17.9...
Aug 01 20:30:17 iZj6cdj8nbj0zla2lnq2g9Z alertmanager[24760]: ts=2022-08-01T12:30:17.9...
Aug 01 20:30:17 iZj6cdj8nbj0zla2lnq2g9Z alertmanager[24760]: ts=2022-08-01T12:30:17.9...
Aug 01 20:30:19 iZj6cdj8nbj0zla2lnq2g9Z alertmanager[24760]: ts=2022-08-01T12:30:19.9...
Hint: Some lines were ellipsized, use -l to show in full.
2.2 使用 Docker 安装
2.2.1下载 Alertmanager 服务
docker pull prom/alertmanager:v0.24.0
2.2.2 运行 Alertmanger 镜像
官方示例:
$ docker run --name alertmanager -d -p 127.0.0.1:9093:9093 quay.io/prometheus/alertmanager
2.3 使用 Kubernetes 安装
2.3.1kubernetes 配置清单如下:
kind: Pod
apiVersion: v1
metadata:
  name: alertmanager-main-0
  generateName: alertmanager-main-
  namespace: kubesphere-monitoring-system
  labels:
    alertmanager: main
    app.kubernetes.io/component: alert-router
    app.kubernetes.io/instance: main
    app.kubernetes.io/managed-by: prometheus-operator
    app.kubernetes.io/name: alertmanager
    app.kubernetes.io/part-of: kube-prometheus
    app.kubernetes.io/version: 0.23.0
    controller-revision-hash: alertmanager-main-cd5bc8fdc
    statefulset.kubernetes.io/pod-name: alertmanager-main-0
  annotations:
    cni.projectcalico.org/containerID: bcc41ec96a5168bb0d4847fccba5329b0e0af5302f84cbb6eaa3f1696b1c16a1
    cni.projectcalico.org/podIP: 10.233.122.54/32
    cni.projectcalico.org/podIPs: 10.233.122.54/32
    k8s.v1.cni.cncf.io/network-status: |-
      [{
          "name": "k8s-pod-network",
          "ips": [
              "10.233.122.54"
          ],
          "default": true,
          "dns": {}
      }]
    k8s.v1.cni.cncf.io/networks-status: |-
      [{
          "name": "k8s-pod-network",
          "ips": [
              "10.233.122.54"
          ],
          "default": true,
          "dns": {}
      }]
    kubectl.kubernetes.io/default-container: alertmanager
spec:
  volumes:
    - name: config-volume
      secret:
        secretName: alertmanager-main-generated
        defaultMode: 420
    - name: tls-assets
      projected:
        sources:
          - secret:
              name: alertmanager-main-tls-assets-0
        defaultMode: 420
    - name: alertmanager-main-db
      emptyDir: {}
    - name: kube-api-access-l48d9
      projected:
        sources:
          - serviceAccountToken:
              expirationSeconds: 3607
              path: token
          - configMap:
              name: kube-root-ca.crt
              items:
                - key: ca.crt
                  path: ca.crt
          - downwardAPI:
              items:
                - path: namespace
                  fieldRef:
                    apiVersion: v1
                    fieldPath: metadata.namespace
        defaultMode: 420
  containers:
    - name: alertmanager
      image: 'registry.cn-beijing.aliyuncs.com/kubesphereio/alertmanager:v0.24.0'
      args:
        - '--config.file=/etc/alertmanager/config/alertmanager.yaml'
        - '--storage.path=/alertmanager'
        - '--data.retention=120h'
        - '--cluster.listen-address='
        - '--web.listen-address=:9093'
        - '--web.route-prefix=/'
        - '--cluster.peer=alertmanager-main-0.alertmanager-operated:9094'
        - '--cluster.reconnect-timeout=5m'
      ports:
        - name: web
          containerPort: 9093
          protocol: TCP
        - name: mesh-tcp
          containerPort: 9094
          protocol: TCP
        - name: mesh-udp
          containerPort: 9094
          protocol: UDP
      env:
        - name: POD_IP
          valueFrom:
            fieldRef:
              apiVersion: v1
              fieldPath: status.podIP
      resources:
        limits:
          cpu: 200m
          memory: 200Mi
        requests:
          cpu: 20m
          memory: 30Mi
      volumeMounts:
        - name: config-volume
          mountPath: /etc/alertmanager/config
        - name: tls-assets
          readOnly: true
          mountPath: /etc/alertmanager/certs
        - name: alertmanager-main-db
          mountPath: /alertmanager
        - name: kube-api-access-l48d9
          readOnly: true
          mountPath: /var/run/secrets/kubernetes.io/serviceaccount
      livenessProbe:
        httpGet:
          path: /-/healthy
          port: web
          scheme: HTTP
        timeoutSeconds: 3
        periodSeconds: 10
        successThreshold: 1
        failureThreshold: 10
      readinessProbe:
        httpGet:
          path: /-/ready
          port: web
          scheme: HTTP
        initialDelaySeconds: 3
        timeoutSeconds: 3
        periodSeconds: 5
        successThreshold: 1
        failureThreshold: 10
      terminationMessagePath: /dev/termination-log
      terminationMessagePolicy: FallbackToLogsOnError
      imagePullPolicy: IfNotPresent
      securityContext:
        capabilities:
          drop:
            - ALL
        readOnlyRootFilesystem: true
        allowPrivilegeEscalation: false
    - name: config-reloader
      image: >-
        registry.cn-beijing.aliyuncs.com/kubesphereio/prometheus-config-reloader:v0.55.1
      command:
        - /bin/prometheus-config-reloader
      args:
        - '--listen-address=:8080'
        - '--reload-url=http://localhost:9093/-/reload'
        - '--watched-dir=/etc/alertmanager/config'
      ports:
        - name: reloader-web
          containerPort: 8080
          protocol: TCP
      env:
        - name: POD_NAME
          valueFrom:
            fieldRef:
              apiVersion: v1
              fieldPath: metadata.name
        - name: SHARD
          value: '-1'
      resources:
        limits:
          cpu: 100m
          memory: 50Mi
        requests:
          cpu: 100m
          memory: 50Mi
      volumeMounts:
        - name: config-volume
          readOnly: true
          mountPath: /etc/alertmanager/config
        - name: kube-api-access-l48d9
          readOnly: true
          mountPath: /var/run/secrets/kubernetes.io/serviceaccount
      terminationMessagePath: /dev/termination-log
      terminationMessagePolicy: FallbackToLogsOnError
      imagePullPolicy: IfNotPresent
      securityContext:
        capabilities:
          drop:
            - ALL
        readOnlyRootFilesystem: true
        allowPrivilegeEscalation: false
  restartPolicy: Always
  terminationGracePeriodSeconds: 120
  dnsPolicy: ClusterFirst
  nodeSelector:
    kubernetes.io/os: linux
  serviceAccountName: alertmanager-main
  serviceAccount: alertmanager-main
  nodeName: k8s-workernode-2-129
  securityContext:
    runAsUser: 1000
    runAsNonRoot: true
    fsGroup: 2000
  hostname: alertmanager-main-0
  subdomain: alertmanager-operated
  affinity:
    podAntiAffinity:
      preferredDuringSchedulingIgnoredDuringExecution:
        - weight: 100
          podAffinityTerm:
            labelSelector:
              matchExpressions:
                - key: alertmanager
                  operator: In
                  values:
                    - main
            namespaces:
              - kubesphere-monitoring-system
            topologyKey: kubernetes.io/hostname
  schedulerName: default-scheduler
  tolerations:
    - key: node.kubernetes.io/not-ready
      operator: Exists
      effect: NoExecute
      tolerationSeconds: 300
    - key: node.kubernetes.io/unreachable
      operator: Exists
      effect: NoExecute
      tolerationSeconds: 300
  priority: 0
  enableServiceLinks: true
  preemptionPolicy: PreemptLowerPriority
三、Alertmanager 配置
在上面,我们对 Alertmanager 进行了快速安装,对于配置文件,使用的是软件包默认自带的 alertmanager.yml 配置文件,它同样也是基于 yaml 语言格式实现的。通过下图,可以看到 Alertmanager 配置文件格式通常包括 global(全局配置)、templates(告警模板)、route(告警路由)、receivers(接收器)和 inhibit_rules(抑制规则)等主要配置项模块,参考地址:https://prometheus.io/docs/alerting/latest/configuration/
global:
  # The default SMTP From header field.
  [ smtp_from: <tmpl_string> ]
  # The default SMTP smarthost used for sending emails, including port number.
  # Port number usually is 25, or 587 for SMTP over TLS (sometimes referred to as STARTTLS).
  # Example: smtp.example.org:587
  [ smtp_smarthost: <string> ]
  # The default hostname to identify to the SMTP server.
  [ smtp_hello: <string> | default = "localhost" ]
  # SMTP Auth using CRAM-MD5, LOGIN and PLAIN. If empty, Alertmanager doesn't authenticate to the SMTP server.
  [ smtp_auth_username: <string> ]
  # SMTP Auth using LOGIN and PLAIN.
  [ smtp_auth_password: <secret> ]
  # SMTP Auth using PLAIN.
  [ smtp_auth_identity: <string> ]
  # SMTP Auth using CRAM-MD5.
  [ smtp_auth_secret: <secret> ]
  # The default SMTP TLS requirement.
  # Note that Go does not support unencrypted connections to remote SMTP endpoints.
  [ smtp_require_tls: <bool> | default = true ]

  # The API URL to use for Slack notifications.
  [ slack_api_url: <secret> ]
  [ slack_api_url_file: <filepath> ]
  [ victorops_api_key: <secret> ]
  [ victorops_api_url: <string> | default = "https://alert.victorops.com/integrations/generic/20131114/alert/" ]
  [ pagerduty_url: <string> | default = "https://events.pagerduty.com/v2/enqueue" ]
  [ opsgenie_api_key: <secret> ]
  [ opsgenie_api_key_file: <filepath> ]
  [ opsgenie_api_url: <string> | default = "https://api.opsgenie.com/" ]
  [ wechat_api_url: <string> | default = "https://qyapi.weixin.qq.com/cgi-bin/" ]
  [ wechat_api_secret: <secret> ]
  [ wechat_api_corp_id: <string> ]
  [ telegram_api_url: <string> | default = "https://api.telegram.org" ]
  # The default HTTP client configuration
  [ http_config: <http_config> ]

  # ResolveTimeout is the default value used by alertmanager if the alert does
  # not include EndsAt, after this time passes it can declare the alert as resolved if it has not been updated.
  # This has no impact on alerts from Prometheus, as they always include EndsAt.
  [ resolve_timeout: <duration> | default = 5m ]

# Files from which custom notification template definitions are read.
# The last component may use a wildcard matcher, e.g. 'templates/*.tmpl'.
templates:
  [ - <filepath> ... ]

# The root node of the routing tree.
route: <route>

# A list of notification receivers.
receivers:
  - <receiver> ...

# A list of inhibition rules.
inhibit_rules:
  [ - <inhibit_rule> ... ]

# DEPRECATED: use time_intervals below.
# A list of mute time intervals for muting routes.
mute_time_intervals:
  [ - <mute_time_interval> ... ]

# A list of time intervals for muting/activating routes.
time_intervals:
  [ - <time_interval> ... ]
3.1global(全局配置)
即全局配置,在 Alertmanager 配置文件中,只要全局配置项中配置的选项内容均为公共配置,便可以作为其他配置项的默认值,也可以被其他配置项中的设置覆盖掉。其中 resolve_timeout 用于设置处理超时时间,是声明告警状态为已解决的时间,它的时长设定有可能影响告警恢复通知的接收时间,默认是 5分钟。如果每一次告警均需要通过电子邮件接收,可以设置用于发送电子邮件的 SMTP 服务器信息和通知服务,其中对应的配置内容如下:
3.1.1设置 smtp 服务
global:
  # The default SMTP From header field.
  [ smtp_from: <tmpl_string> ]    #发送邮件的名称
  # The default SMTP smarthost used for sending emails, including port number.
  # Port number usually is 25, or 587 for SMTP over TLS (sometimes referred to as STARTTLS).
  # Example: smtp.example.org:587
  [ smtp_smarthost: <string> ]    #邮件 SMTP 服务器代理地址
  # The default hostname to identify to the SMTP server.
  [ smtp_hello: <string> | default = "localhost" ]
  # SMTP Auth using CRAM-MD5, LOGIN and PLAIN. If empty, Alertmanager doesn't authenticate to the SMTP server.
  [ smtp_auth_username: <string> ]  #邮箱用户名称
  # SMTP Auth using LOGIN and PLAIN.
  [ smtp_auth_password: <secret> ]  #邮箱用户密码
  # SMTP Auth using PLAIN.
  [ smtp_auth_identity: <string> ]
  # SMTP Auth using CRAM-MD5.
  [ smtp_auth_secret: <secret> ]
  # The default SMTP TLS requirement.
  # Note that Go does not support unencrypted connections to remote SMTP endpoints.
  [ smtp_require_tls: <bool> | default = true ]   # 如果使用 TLS 则设置为 true
3.2 templates
告警模块可以自定义告警通知的外观格式及其包含的对应的告警数据。在 templates 部分中包含告警模板的目录列表,也就是设置已存在的模板文件的路径,例如:
templates:
- '/usr/local/alertmanager/current/templates/*.tmpl'
Alertmanager 启动时加载该路径下的模板文件。可以自己定义告警模板。
3.3route
告警路由模块描述了在收到 Prometheus server 生产的告警后,将告警发送到 receiver 指定的目的地址的规则。Alertmanager 对传入的告警信息进行处理,根据所定义的规则和操作进行匹配。所有路由的组合可以理解为树状结构,设置的第一个 route 称为根节点,其后包括的节点称为子节点。每个告警都从配置的根节点路由进入路由树,按照深度优先从左到右进行遍历匹配,在所匹配的节点上停止。如果告警与节点的任何子节点都不匹配,也就是说没有可匹配的子节点,则根据当前节点的配置参数处理告警。
3.3.1route 的常见配置选项内容
[ receiver: <string> ]
# The labels by which incoming alerts are grouped together. For example,
# multiple alerts coming in for cluster=A and alertname=LatencyHigh would
# be batched into a single group.
#
# To aggregate by all possible labels use the special value '...' as the sole label name, for example:
# group_by: ['...']
# This effectively disables aggregation entirely, passing through all
# alerts as-is. This is unlikely to be what you want, unless you have
# a very low alert volume or your upstream notification system performs
# its own grouping.
[ group_by: '[' <labelname>, ... ']' ]

# Whether an alert should continue matching subsequent sibling nodes.
[ continue: <boolean> | default = false ]

# DEPRECATED: Use matchers below.
# A set of equality matchers an alert has to fulfill to match the node.
match:
  [ <labelname>: <labelvalue>, ... ]

# DEPRECATED: Use matchers below.
# A set of regex-matchers an alert has to fulfill to match the node.
match_re:
  [ <labelname>: <regex>, ... ]

# A list of matchers that an alert has to fulfill to match the node.
matchers:
  [ - <matcher> ... ]

# How long to initially wait to send a notification for a group
# of alerts. Allows to wait for an inhibiting alert to arrive or collect
# more initial alerts for the same group. (Usually ~0s to few minutes.)
[ group_wait: <duration> | default = 30s ]

# How long to wait before sending a notification about new alerts that
# are added to a group of alerts for which an initial notification has
# already been sent. (Usually ~5m or more.)
[ group_interval: <duration> | default = 5m ]

# How long to wait before sending a notification again if it has already
# been sent successfully for an alert. (Usually ~3h or more).
[ repeat_interval: <duration> | default = 4h ]

# Times when the route should be muted. These must match the name of a
# mute time interval defined in the mute_time_intervals section.
# Additionally, the root node cannot have any mute times.
# When a route is muted it will not send any notifications, but
# otherwise acts normally (including ending the route-matching process
# if the `continue` option is not set.)
mute_time_intervals:
  [ - <string> ...]

# Times when the route should be active. These must match the name of a
# time interval defined in the time_intervals section. An empty value
# means that the route is always active.
# Additionally, the root node cannot have any active times.
# The route will send notifications only when active, but otherwise
# acts normally (including ending the route-matching process
# if the `continue` option is not set).
active_time_intervals:
  [ - <string> ...]

# Zero or more child routes.
routes:
  [ - <route> ... ]
3.3.2 route 的一个配置示例
# The root route with all parameters, which are inherited by the child
# routes if they are not overwritten.
route:
  receiver: 'default-receiver'
  group_wait: 30s
  group_interval: 5m
  repeat_interval: 4h
  group_by: [cluster, alertname]
  # All alerts that do not match the following child routes
  # will remain at the root node and be dispatched to 'default-receiver'.
  routes:
  # All alerts with service=mysql or service=cassandra
  # are dispatched to the database pager.
  - receiver: 'database-pager'
    group_wait: 10s
    matchers:
    - service=~"mysql|cassandra"
  # All alerts with the team=frontend label match this sub-route.
  # They are grouped by product and environment rather than cluster
  # and alertname.
  - receiver: 'frontend-pager'
    group_by: [product, environment]
    matchers:
    - team="frontend"

  # All alerts with the service=inhouse-service label match this sub-route.
  # the route will be muted during offhours and holidays time intervals.
  # even if it matches, it will continue to the next sub-route
  - receiver: 'dev-pager'
    matchers:
      - service="inhouse-service"
    mute_time_intervals:
      - offhours
      - holidays
    continue: true

    # All alerts with the service=inhouse-service label match this sub-route
    # the route will be active only during offhours and holidays time intervals.
  - receiver: 'on-call-pager'
    matchers:
      - service="inhouse-service"
    active_time_intervals:
      - offhours
      - holidays
3.3.3 route 选项说明
| 选型 | 说明 |
|---|---|
| [ receiver: |
配置要发送告警说明的接收器名称。 |
| [ group_by: ‘[’ |
指定要分组的标签,若告警中包含的标签符合 group_by 中指定的标签名称,这些告警会被合并为一个通知发送接收器,即实现告警分组。 |
| [ continue: |
若设置为 false,则告警在满足条件时终止所有匹配处理,并且忽略后续节点;若设置为 true,则告警会继续进行后续子节点的匹配。 |
| match: [ |
通过字符形式进行告警匹配设置,用于判断当前告警中是否具有标签 labelname 且等于 labelvalue |
| match_re: [ |
通过正则表达式进行告警匹配设置,判断当前告警标签是否适配正则表达式的信息。 |
| matchers: [ - |
警报必须满足以匹配节点的匹配器列表。 |
| [ group_wait: |
设置从接收告警到发送的等待时间,若在等待时间内当前 group 接收到了新的告警,这些告警会被合并为一个通知进行发送,默认设置为 30秒 |
| [ group_interval: |
设置相同的 group 之间发送告警通知的时间间隔,默认设置为 5分钟。 |
| [ repeat_interval: |
设置告警成功发送后能够再次发送完全相同的告警的时间间隔,默认是 4小时。 |
| routes: [ - |
可进行子路由节点匹配设置 |
3.3.4 web 浏览器管理 alertmanager 配置文件
- 3.3.4.1打开浏览器,输入地址:https://prometheus.io/webtools/alerting/routing-tree-editor/
- 3.3.4.2复制 Alertmanager 配置文件内容到编辑工具中,点击 “Draw Routing Tree” 按钮即可看到路由结构信息,以上面 alertmanager 示例为例

3.4 receivers
接收器是一个统称,每个 receiver 需要一个全局唯一名称,并且对应一个或者多个通知方式,包括电子邮箱、微信、PagerDuty、HipChat 和 Webhook 等。目前官方提供的接收器配置选项如下(https://prometheus.io/docs/alerting/latest/configuration/#duration):
# The unique name of the receiver.
name: <string>  #设置接收器名称

# Configurations for several notification integrations.
email_configs:  #常用电子邮件告警
  [ - <email_config>, ... ]
opsgenie_configs:
  [ - <opsgenie_config>, ... ]
pagerduty_configs:
  [ - <pagerduty_config>, ... ]
pushover_configs:
  [ - <pushover_config>, ... ]
slack_configs:
  [ - <slack_config>, ... ]
sns_configs:
  [ - <sns_config>, ... ]
victorops_configs:
  [ - <victorops_config>, ... ]
webhook_configs: #官方建议通过 webhook 接收器实现自定义通知集成
  [ - <webhook_config>, ... ]
wechat_configs:  #已经对微信告警进行支持
  [ - <wechat_config>, ... ]
telegram_configs:
  [ - <telegram_config>, ... ]
3.5 inhibit_rules
在 inhibit_rules 模块中设置实现告警抑制功能,我们可以指定在特定条件下要忽略的告警条件。可以使用此选项设置首选项,例如优先处理某些告警,如果同一组中的告警同时发生,则忽略其他告警。合理设置抑制规则可以减少 “垃圾” 告警的产生。
3.5.1 inhibit_rules 模块的常见配置内容
# DEPRECATED: Use target_matchers below.
# Matchers that have to be fulfilled in the alerts to be muted.
target_match:
  [ <labelname>: <labelvalue>, ... ]
# DEPRECATED: Use target_matchers below.
target_match_re:
  [ <labelname>: <regex>, ... ]

# A list of matchers that have to be fulfilled by the target
# alerts to be muted.
target_matchers:
  [ - <matcher> ... ]

# DEPRECATED: Use source_matchers below.
# Matchers for which one or more alerts have to exist for the
# inhibition to take effect.
source_match:
  [ <labelname>: <labelvalue>, ... ]
# DEPRECATED: Use source_matchers below.
source_match_re:
  [ <labelname>: <regex>, ... ]

# A list of matchers for which one or more alerts have
# to exist for the inhibition to take effect.
source_matchers:
  [ - <matcher> ... ]

# Labels that must have an equal value in the source and target
# alert for the inhibition to take effect.
[ equal: '[' <labelname>, ... ']' ]
3.5.2 inhibit_rules 模块的一个配置示例
  # 一个inhibition规则是在与另一组匹配器匹配的警报存在的条件下,使匹配一组匹配器的警报失效的规则。
# 两个警报必须具有一组相同的标签。
inhibit_rules:                         # 抑制规则
  - source_match:                     # 当存在源标签告警触发时抑制含有目标标签的告警
      alertname: 'TORouterDown'
    target_match_re:
      alertname: '.*Unrechable'     # 目标标签值正则匹配,如 RedisUnreachable
    equal: ['dc', 'rack']            # 保证该配置下标签内容相同才会被抑制
当 alertmanager: ‘TORouterDown’ 时,目标和源告警必须具有与 equal 列表中标签名称相同的标签值,目标中正则匹配到的 alertmanager: ‘.*Unreachable’ 才会被抑制从而不发送。
四、Alertmanager 默认配置文件内容
route:
  group_by: ['alertname']
  group_wait: 30s
  group_interval: 5m
  repeat_interval: 1h
  receiver: 'web.hook'
receivers:
- name: 'web.hook'
  webhook_configs:
  - url: 'http://127.0.0.1:5001/'
inhibit_rules:
  - source_match:
      severity: 'critical'
    target_match:
      severity: 'warning'
    equal: ['alertname', 'dev', 'instance']
Alertmanager 与 Prometheus 集成
这里我们使用 Prometheus 的默认配置文件 prometheus.yml 来实现 Prometheus server 与 alertmanager 组件的关联,并对告警规则及其模版内容进行介绍。
一、与 Alertmanager 关联
Prometheus 把生产的告警发送给 Alertmanager 进行告警处理时,需要在 Prometheus 使用的配置文件中添加关联 Alertmanager 组件的对应配置内容。
编辑 prometheus.yml 文件加入关联 Alertmanager 组件的访问地址,示例如下:
alerting:
  alertmanagers:
      - static_configs:
             - targets:
                    - 127.0.0.1:9093
这样prometheus就能将报警信息转发到alertmanager,再通过alertmanager的route配置向下转发。
二、告警规则
告警规则文件使用 YAML 格式进行定义,在 Prometheus server 中使用 PromQL 配置实际告警触发条件,Prometheus 会根据告警规则及配置周期进行周期性计算,若满足触发条件则会触发告警通知。告警规则的加载是在 prometheus.yml 文件中进行配置,默认情况下 Prometheus 对设置的告警规则进行计算的时间间隔是 1分钟,可以使用 global 中的 evaluation_interval 配置选项设置间隔时间。例如:
global:
    evaluation_interval: 15s
告警规则可以直接指定文件,也可以指定到特定的目录下,为了方便管理也可以把告警规则则拆分成多个文件,以特定的命名格式被 Prometheus.yml 指定后加载,例如:
rule_files:
      - "/usr/local/prometheus/current/rules/*_rules.yml" -
      - "second_rules.yml"
我们先看一个简单的 node_exporter 示例:
groups:
- name: 服务器资源监控
  rules:
  - alert: 内存使用率过高
#    expr: (node_memory_Buffers_bytes+node_memory_Cached_bytes+node_memory_MemFree_bytes)/node_memory_MemTotal_bytes*100 > 90
    expr: (1 - (node_memory_MemAvailable_bytes / node_memory_MemTotal_bytes)) * 100 > 90
    for: 5m  # 告警持续时间,超过这个时间才会发送给alertmanager
    labels:
      severity: 严重告警
    annotations:
      summary: "{{ $labels.instance }} 内存使用率过高,请尽快处理!"
      description: "{{ $labels.instance }}内存使用率超过90%,当前使用率{{ $value }}%."

  - alert: 服务器宕机
    expr: up == 0
    for: 3m
    labels:
      severity: 严重告警
    annotations:
      summary: "{{$labels.instance}} 服务器宕机,请尽快处理!"
      description: "{{$labels.instance}} 服务器延时超过3分钟,当前状态{{ $value }}. "

  - alert: CPU高负荷
    expr: 100 - (avg by (instance,job)(irate(node_cpu_seconds_total{mode="idle"}[5m])) * 100) > 90
    for: 5m
    labels:
      severity: 严重告警
    annotations:
      summary: "{{$labels.instance}} CPU使用率过高,请尽快处理!"
      description: "{{$labels.instance}} CPU使用大于90%,当前使用率{{ $value }}%. "

  - alert: 磁盘IO性能
    expr: avg(irate(node_disk_io_time_seconds_total[1m])) by(instance,job)* 100 > 90
    for: 5m
    labels:
      severity: 严重告警
    annotations:
      summary: "{{$labels.instance}} 流入磁盘IO使用率过高,请尽快处理!"
      description: "{{$labels.instance}} 流入磁盘IO大于90%,当前使用率{{ $value }}%."


  - alert: 网络流入
    expr: ((sum(rate (node_network_receive_bytes_total{device!~'tap.*|veth.*|br.*|docker.*|virbr*|lo*'}[5m])) by (instance,job)) / 100) > 102400
    for: 5m
    labels:
      severity: 严重告警
      severity: 严重告警
    annotations:
      summary: "{{$labels.instance}} 流入网络带宽过高,请尽快处理!"
      description: "{{$labels.instance}} 流入网络带宽持续5分钟高于100M. RX带宽使用量{{$value}}."

  - alert: 网络流出
    expr: ((sum(rate (node_network_transmit_bytes_total{device!~'tap.*|veth.*|br.*|docker.*|virbr*|lo*'}[5m])) by (instance,job)) / 100) > 102400
    for: 5m
    labels:
      severity: 严重告警
    annotations:
      summary: "{{$labels.instance}} 流出网络带宽过高,请尽快处理!"
      description: "{{$labels.instance}} 流出网络带宽持续5分钟高于100M. RX带宽使用量{$value}}."

  - alert: TCP连接数
    expr: node_netstat_Tcp_CurrEstab > 10000
    for: 2m
    labels:
      severity: 严重告警
    annotations:
      summary: " TCP_ESTABLISHED过高!"
      description: "{{$labels.instance}} TCP_ESTABLISHED大于100%,当前使用率{{ $value }}%."

  - alert: 磁盘容量
    expr: (node_filesystem_size_bytes{fstype=~"ext.?|xfs"}-node_filesystem_free_bytes{fstype=~"ext.?|xfs"}) *100/(node_filesystem_avail_bytes {fstype=~"ext.?|xfs"}+(node_filesystem_size_bytes{fstype=~"ext.?|xfs"}-node_filesystem_free_bytes{fstype=~"ext.?|xfs"})) > 90
    for: 1m
    labels:
      severity: 严重告警
    annotations:
      summary: "{{$labels.mountpoint}} 磁盘分区使用率过高,请尽快处理!"
      description: "{{$labels.instance}} 磁盘分区使用大于90%,当前使用率{{ $value }}%."
此文件添加了一些规则,当prometheus监测到触发参数,就将发送到alertmanager。alertmanager再通过配置文件向下转发告警信息。
配置企业微信接收通知
这里通常分为两送情况:1、拥有企业微信管理后台权限。2、没有权限。
一、 拥有企业微信管理后台权限
alertmanager 本身已经集成了企业微信,可以直接配置使用。prometheus官网中给出了企业微信的相关配置说明,如下:
# Whether to notify about resolved alerts.
[ send_resolved: <boolean> | default = false ]

# The API key to use when talking to the WeChat API.
[ api_secret: <secret> | default = global.wechat_api_secret ]

# The WeChat API URL.
[ api_url: <string> | default = global.wechat_api_url ]

# The corp id for authentication.
[ corp_id: <string> | default = global.wechat_api_corp_id ]

# API request data as defined by the WeChat API.
[ message: <tmpl_string> | default = '{{ template "wechat.default.message" . }}' ]
# Type of the message type, supported values are `text` and `markdown`.
[ message_type: <string> | default = 'text' ]
[ agent_id: <string> | default = '{{ template "wechat.default.agent_id" . }}' ]
[ to_user: <string> | default = '{{ template "wechat.default.to_user" . }}' ]
[ to_party: <string> | default = '{{ template "wechat.default.to_party" . }}' ]
[ to_tag: <string> | default = '{{ template "wechat.default.to_tag" . }}' ]
企业微信相关概念说明请参考企业微信API说明,可以在企业微信的后台中建立多个应用,每个应用对应不同的报警分组,由企业微信来做接收成员的划分。具体配置参考如下:
global:
  resolve_timeout: 10m
  wechat_api_url: 'https://qyapi.weixin.qq.com/cgi-bin/'
  wechat_api_secret: '应用的secret,在应用的配置页面可以看到'
  wechat_api_corp_id: '企业id,在企业的配置页面可以看到'
templates:
- '/etc/alertmanager/config/*.tmpl'  //使用报警信息的模板。
route:
  group_by: ['alertname']
  group_wait: 30s
  group_interval: 5m
  repeat_interval: 12h
  routes:
  - receiver: 'wechat'
    continue: true
inhibit_rules:
- source_match:
receivers:
- name: 'wechat'
  wechat_configs:
  - send_resolved: false
    corp_id: '企业id,在企业的配置页面可以看到'
    to_user: '@all'
    to_party: ' PartyID1 | PartyID2 '
    message: '{{ template "wechat.default.message" . }}'
    agent_id: '应用的AgentId,在应用的配置页面可以看到'
    api_secret: '应用的secret,在应用的配置页面可以看到'
配置模板示例如下:
{{ define "wechat.default.message" }}
{{- if gt (len .Alerts.Firing) 0 -}}
{{- range $index, $alert := .Alerts -}}
{{- if eq $index 0 -}}
告警类型: {{ $alert.Labels.alertname }}
告警级别: {{ $alert.Labels.severity }}

=====================
{{- end }}
===告警详情===
告警详情: {{ $alert.Annotations.message }}
故障时间: {{ $alert.StartsAt.Format "2006-01-02 15:04:05" }}
===参考信息===
{{ if gt (len $alert.Labels.instance) 0 -}}故障实例ip: {{ $alert.Labels.instance }};{{- end -}}
{{- if gt (len $alert.Labels.namespace) 0 -}}故障实例所在namespace: {{ $alert.Labels.namespace }};{{- end -}}
{{- if gt (len $alert.Labels.node) 0 -}}故障物理机ip: {{ $alert.Labels.node }};{{- end -}}
{{- if gt (len $alert.Labels.pod_name) 0 -}}故障pod名称: {{ $alert.Labels.pod_name }}{{- end }}
=====================
{{- end }}
{{- end }}

{{- if gt (len .Alerts.Resolved) 0 -}}
{{- range $index, $alert := .Alerts -}}
{{- if eq $index 0 -}}
告警类型: {{ $alert.Labels.alertname }}
告警级别: {{ $alert.Labels.severity }}

=====================
{{- end }}
===告警详情===
告警详情: {{ $alert.Annotations.message }}
故障时间: {{ $alert.StartsAt.Format "2006-01-02 15:04:05" }}
恢复时间: {{ $alert.EndsAt.Format "2006-01-02 15:04:05" }}
===参考信息===
{{ if gt (len $alert.Labels.instance) 0 -}}故障实例ip: {{ $alert.Labels.instance }};{{- end -}}
{{- if gt (len $alert.Labels.namespace) 0 -}}故障实例所在namespace: {{ $alert.Labels.namespace }};{{- end -}}
{{- if gt (len $alert.Labels.node) 0 -}}故障物理机ip: {{ $alert.Labels.node }};{{- end -}}
{{- if gt (len $alert.Labels.pod_name) 0 -}}故障pod名称: {{ $alert.Labels.pod_name }};{{- end }}
=====================
{{- end }}
{{- end }}
{{- end }}
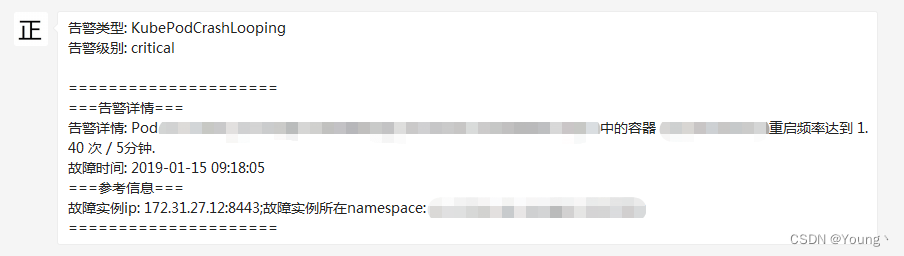
这时如果某一容器频繁重启,可以接收到如下的告警内容
没有后台权限
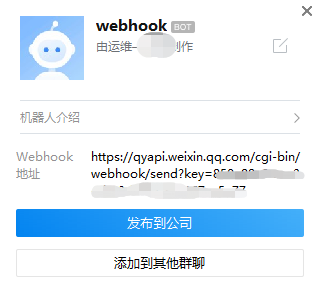
当没有企业微信后台权限的情况下,大家可以先到企业微信随便拉个群,然后建立WEBHOOK机器人。具体参考:https://open.work.weixin.qq.com/help2/pc/14931
1、安装企业微信插件。
在alertmanager所在服务器安装Alertmanager-wechatrobot-webhook插件
https://github.com/k8stech/alertmanager-wechatrobot-webhook
1.1 下载后解压安装,需要GO环境,但是因为GITLAB网络原因,我这里无法完成编译。- -!
1.2 有大哥把他做成了DOCKER镜像,带参数直接跑,本次使用的是这个方法。而且镜像里还带个默认的模版。
镜像为:guyongquan/webhook-adapter
启动命令:
docker run -d --name wechat-webhook --restart always -p 9105:80 -v /usr/local/alertmanager-0.23.0.linux-amd64/wx.js:/app/prometheusalert/wx.js guyongquan/webhook-adapter --adapter=/app/prometheusalert/wx.js=/wx=https://qyapi.weixin.qq.com/cgi-bin/webhook/send?key=xxxxxx
参数说明:
镜像为:guyongquan/webhook-adapter
https://qyapi.weixin.qq.com/cgi-bin/webhook/send?key=xxxxxx为企业微信群告警机器人的url(xxxxxxx就是打码的这部分)
–adapter:/app/prometheusalert/wx.js=/wx=微信群机器人地址
-v参数指定的wx.js文件,和告警内容有关,可修改其内容,默认镜像里包含wx.js文件,可不映射外部的wx.js文件
2、修改alertmanager配置文件,配置通过webhook告警,url参数即为搭建的webhook代理的地址。
示例:
global:
  resolve_timeout: 5m
route:
  group_by: ['alertname']
  group_wait: 10s
  group_interval: 5m
  repeat_interval: 30m
  receiver: 'webhook'
receivers:
- name: 'webhook'
  webhook_configs:
  - url: 'http://127.0.0.1:9105/adapter/wx' //容器运行的地址,端口。
    send_resolved: true
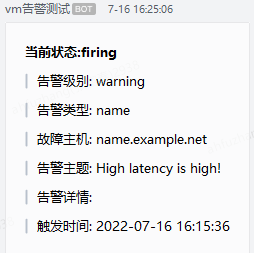
到这里就结束了,如果想测试:插件到企业微信机器人的连通信,可以用 curl.比如:
curl -X POST "http://127.0.0.1:9105/adapter/wx" -H "Content-type: application/json" -d '[{"status": "firing","labels": {"alertname": "name","service": "my-service","severity":"warning","instance": "name.example.net"},"annotations": {"summary": "High latency is high!"},
集成邮件系统
邮箱应该是目前企业最常用的告警通知方式,Alertmanager内置了对SMTP协议的支持,因此对于企业用户而言,只需要一些基本的配置即可实现通过邮件的通知。
在Alertmanager使用邮箱通知,用户只需要定义好SMTP相关的配置,并且在receiver中定义接收方的邮件地址即可。在Alertmanager中我们可以直接在配置文件的global中定义全局的SMTP配置:
global:
  [ smtp_from: <tmpl_string> ]
  [ smtp_smarthost: <string> ]
  [ smtp_hello: <string> | default = "localhost" ]
  [ smtp_auth_username: <string> ]
  [ smtp_auth_password: <secret> ]
  [ smtp_auth_identity: <string> ]
  [ smtp_auth_secret: <secret> ]
  [ smtp_require_tls: <bool> | default = true ]
完成全局SMTP之后,我们只需要为receiver配置email_configs用于定义一组接收告警的邮箱地址即可,如下所示:
name: <string>
email_configs:
  [ - <email_config>, ... ]
每个email_config中定义相应的接收人邮箱地址,邮件通知模板等信息即可,当然如果当前接收人需要单独的SMTP配置,那直接在email_config中覆盖即可:
[ send_resolved: <boolean> | default = false ]
to: <tmpl_string>
[ html: <tmpl_string> | default = '{{ template "email.default.html" . }}' ]
[ headers: { <string>: <tmpl_string>, ... } ]
如果当前收件人需要接受告警恢复的通知的话,在email_config中定义send_resolved为true即可。
如果所有的邮件配置使用了相同的SMTP配置,则可以直接定义全局的SMTP配置。
这里,以Gmail邮箱为例,我们定义了一个全局的SMTP配置,并且通过route将所有告警信息发送到default-receiver中:
global:
  smtp_smarthost: smtp.gmail.com:587
  smtp_from: <smtp mail from>
  smtp_auth_username: <usernae>
  smtp_auth_identity: <username>
  smtp_auth_password: <password>

route:
  group_by: ['alertname']
  receiver: 'default-receiver'

receivers:
  - name: default-receiver
    email_configs:
      - to: <mail to address>
        send_resolved: true
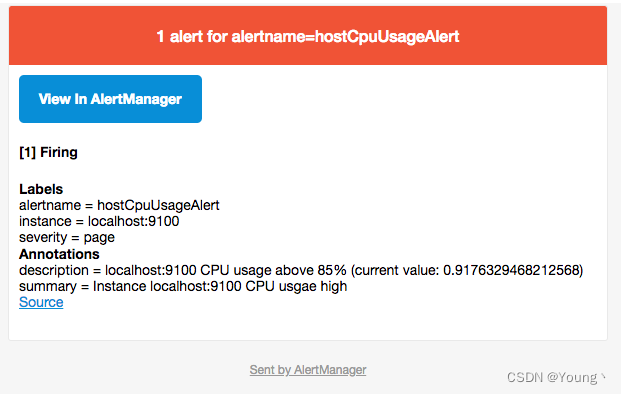
这时如果手动拉高主机CPU使用率,使得监控样本数据满足告警触发条件。在SMTP配置正确的情况下,可以接收到如下的告警内容:
评论区