


一、blackbox_exporter介绍
blackbox_exporter 是 Prometheus 官方提供的一个 exporter, 可以监控 HTTP、HTTPS,、 DNS、 TCP 、 ICMP 等目标实例, 从而实现对被监控节点进行监控和数据采集。
- HTTP/HTPPS: URL/API 可用性检测
- TCP: 端口监听检测
- ICMP: 主机存活检测
- DNS: 域名解析
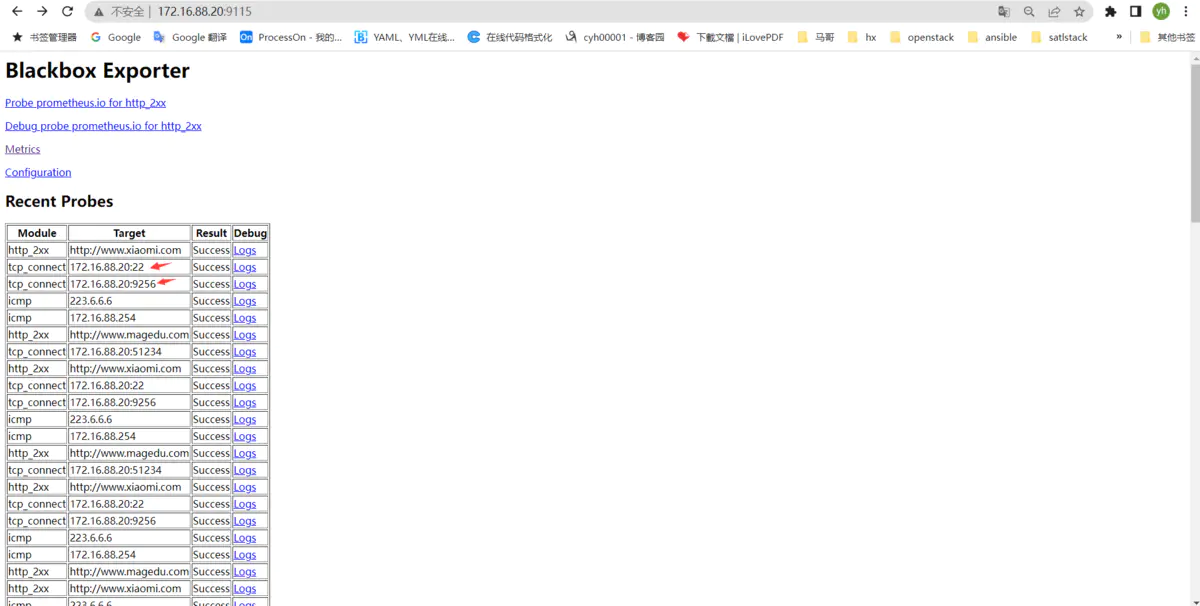
二、安装部署blackbox_exporter
wget https://github.com/prometheus/blackbox_exporter/releases/download/v0.23.0/blackbox_exporter-0.23.0.linux-amd64.tar.gz

tar -zxvf blackbox_exporter-0.23.0.linux-amd64.tar.gz

mv blackbox_exporter-0.23.0.linux-amd64/ /usr/local/blackbox_exporter
使用systemd管理blackbox_exporter
[Unit]
Description=Prometheus Blackbox Exporter
After=network.target

[Service]
Type=simple
User=prometheus
Group=prometheus

ExecStart=/usr/local/blackbox_exporter/blackbox_exporter \
--config.file=/usr/ocal/blackbox_exporter/blackbox.yml \
--web.listen-address=:9115
Restart=on-failure

[Install]
WantedBy=multi-user.target
查看运行状态:
[root@centos ~]# systemctl status blackbox-exporter.service
● blackbox-exporter.service - Prometheus Blackbox Exporter
   Loaded: loaded (/etc/systemd/system/blackbox-exporter.service; enabled; vendor preset: disabled)
   Active: active (running) since Tue 2022-09-27 16:56:04 CST; 1min 13s ago
 Main PID: 29832 (blackbox_export)
    Tasks: 8 (limit: 49440)
   Memory: 4.9M
   CGroup: /system.slice/blackbox-exporter.service
           └─29832 /apps/blackbox_exporter/blackbox_exporter --config.file=/apps/blackbox_exporter/blackbox.yml --web.listen-address=:9115

Sep 27 16:56:04 centos systemd[1]: Started Prometheus Blackbox Exporter.
Sep 27 16:56:04 centos blackbox_exporter[29832]: ts=2022-09-27T08:56:04.252Z caller=main.go:256 level=info msg="Starting blackbox_exporter" version="(version=0.22.0, >
Sep 27 16:56:04 centos blackbox_exporter[29832]: ts=2022-09-27T08:56:04.253Z caller=main.go:257 level=info build_context="(go=go1.18.5, user=root@4d81de342d10, date=2>
Sep 27 16:56:04 centos blackbox_exporter[29832]: ts=2022-09-27T08:56:04.255Z caller=main.go:269 level=info msg="Loaded config file"
Sep 27 16:56:04 centos blackbox_exporter[29832]: ts=2022-09-27T08:56:04.257Z caller=main.go:417 level=info msg="Listening on address" address=:9115
Sep 27 16:56:04 centos blackbox_exporter[29832]: ts=2022-09-27T08:56:04.258Z caller=tls_config.go:195 level=info msg="TLS is disabled." http2=false
[root@centos ~]# netstat -tnlp | grep 9115
Active Internet connections (only servers)
Proto Recv-Q Send-Q Local Address           Foreign Address         State       PID/Program name
tcp6       0      0 :::9115                 :::*                    LISTEN      29832/blackbox_expo
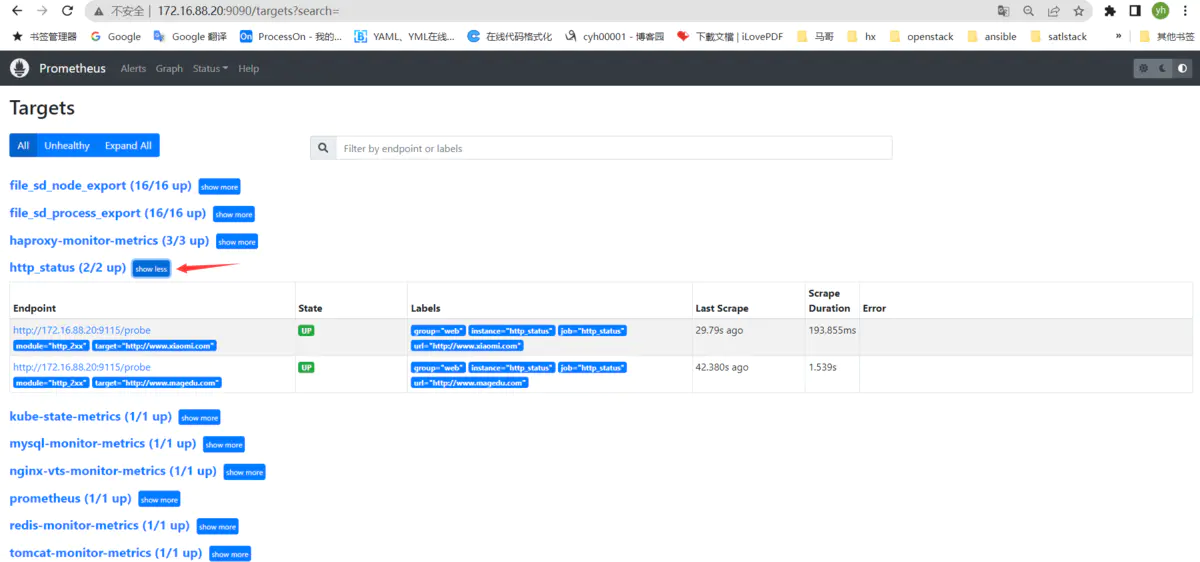
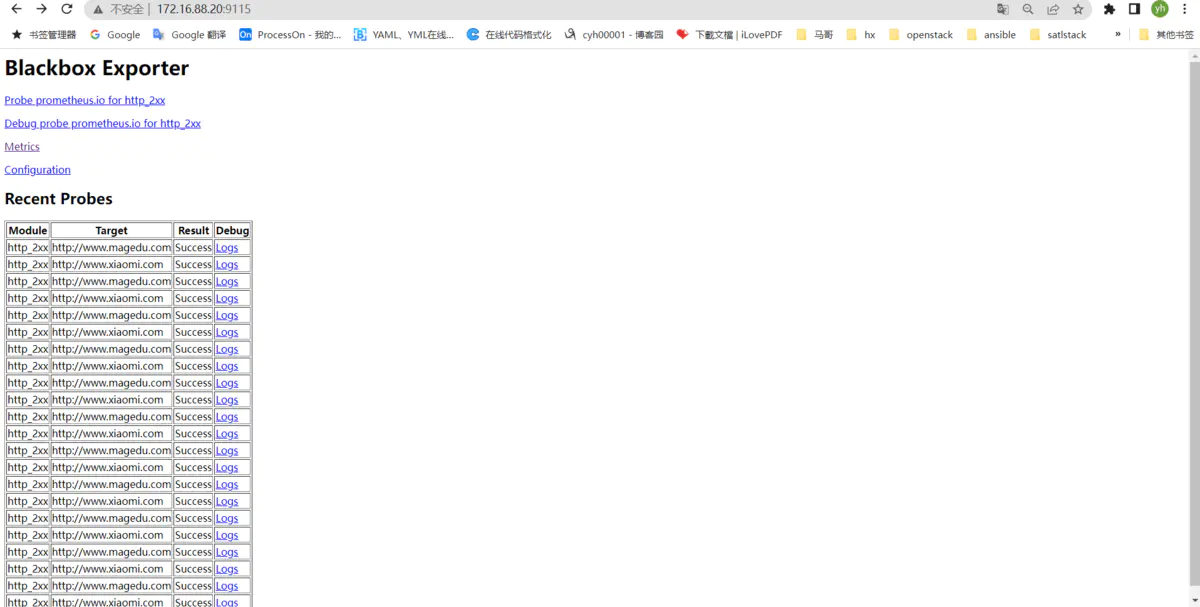
2.1、blackbox exporter 实现 URL 监控
配置Prometheus.yaml
  - job_name: 'http_status'
    metrics_path: /probe #指定指标接口
    params: #指定查询参数,在Prometheus向target发送Get请求获取指标数据时,会传递到url上
      module: [http_2xx]
    static_configs:
      - targets: ['http://www.xiaomi.com', 'http://www.magedu.com']
        labels: #自定义标签,附加在target上
          instance: http_status
          group: web
    relabel_configs:
      - source_labels: [__address__] # 将__address__(当前监控目标URL地址的标签)修改为__param_target,用于传递给blackbox_exporter
        target_label: __param_target #标签key为__param_target、value为www.xiaomi.mkey为__param_target、value为www.magedu.com
      - source_labels: [__param_target] #基于__param_target获取监控目标
        target_label: url #将监控目标的值与 url 创建一个label
      - target_label: __address__ #新添加一个目标__address__,指向blackbox_exporter服务器地址,用于将监控请求发送给指定的blackbox_exporter服务器
        replacement: 172.16.88.20:9115 #指定blackbox_exporter服务器地址

#API Serevr节点发现
[root@centos prometheus]# ./promtool check config prometheus.yml
Checking prometheus.yml
 SUCCESS: prometheus.yml is valid prometheus config file syntax

[root@centos prometheus]# systemctl restart prometheus.service
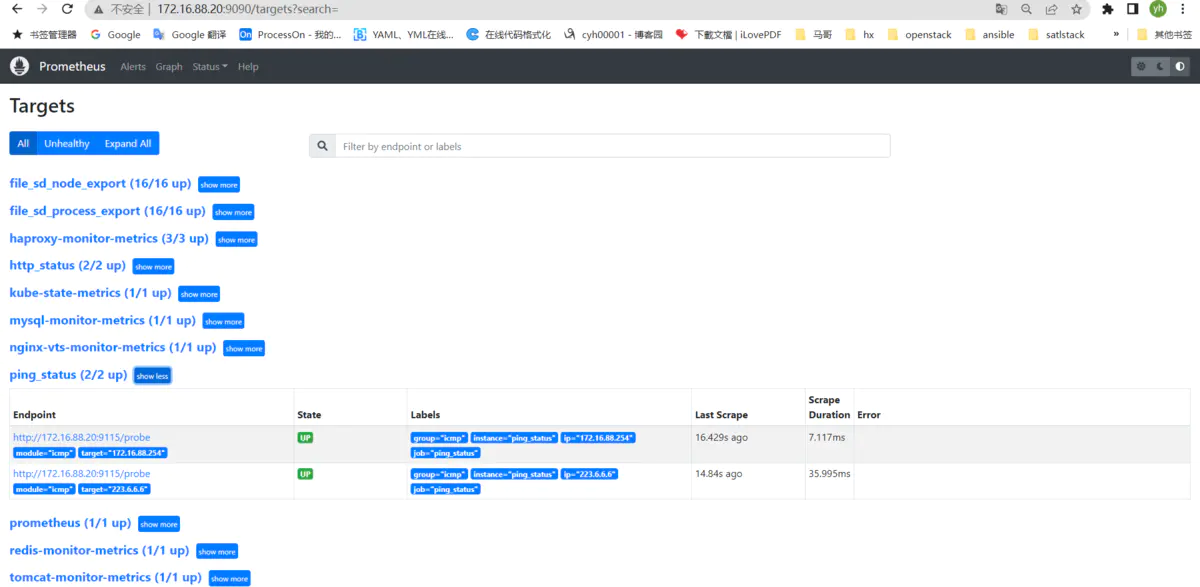
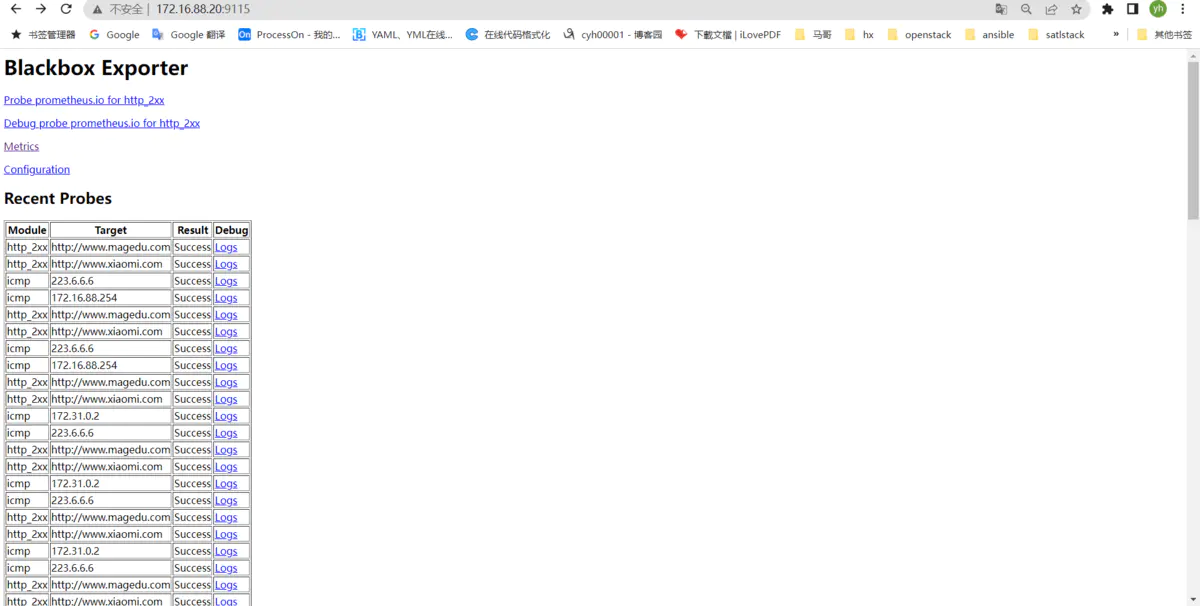
2.2、blackbox exporter 实现 ICMP 监控
ICMP就是Ping使用的协议,可以探测IP是否在线:
[root@centos prometheus]# vim prometheus.yml
[root@centos prometheus]# ./promtool check config prometheus.yml
Checking prometheus.yml
 SUCCESS: prometheus.yml is valid prometheus config file syntax
[root@centos prometheus]# grep ping_status  -A10  prometheus.yml
  - job_name: 'ping_status'
    metrics_path: /probe
    params:
     module: [icmp]
    static_configs:
    - targets: ['172.16.88.254',"223.6.6.6"]
      labels:
        instance: 'ping_status'
        group: 'icmp'
    relabel_configs:
      - source_labels: [__address__]
        target_label: __param_target
      - source_labels: [__param_target]
        target_label: ip
      - target_label: __address__
        replacement: 172.16.88.20:9115

#API Serevr节点发现
[root@centos prometheus]# systemctl restart prometheus.service
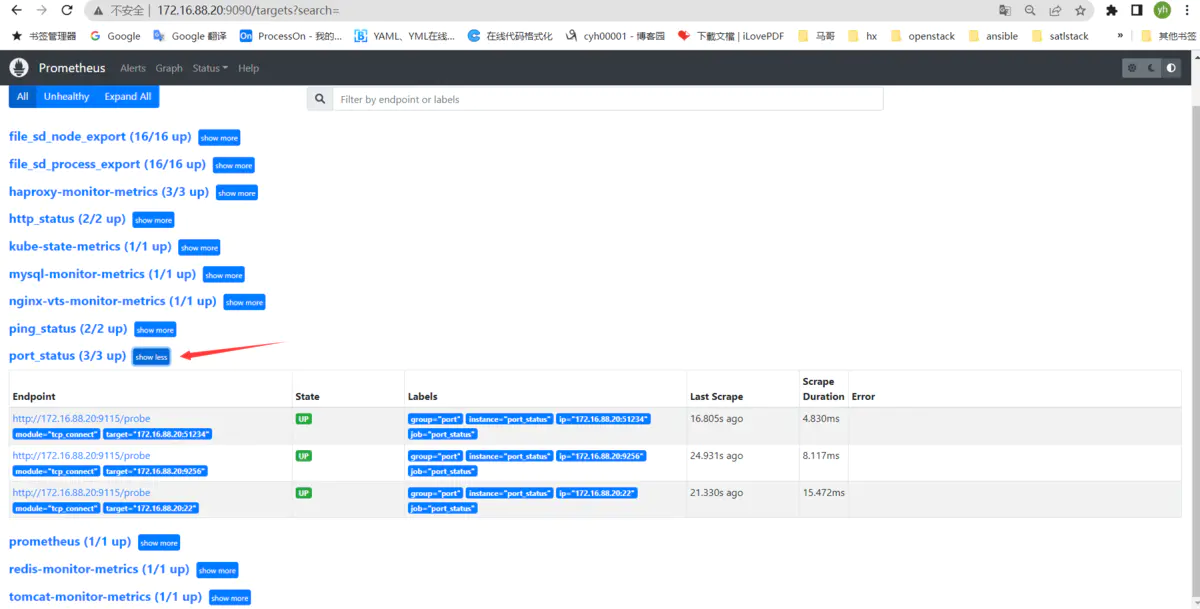
2.3、blackbox exporter 实现端口监控
[root@centos prometheus]# vim prometheus.yml
[root@centos prometheus]# ./promtool check config prometheus.yml
Checking prometheus.yml
 SUCCESS: prometheus.yml is valid prometheus config file syntax

[root@centos prometheus]# grep port_status  -A10  prometheus.yml
  - job_name: 'port_status'
    metrics_path: /probe
    params:
     module: [tcp_connect]
    static_configs:
      - targets: ['172.16.88.20:51234', '172.16.88.20:9256','172.16.88.20:22']
        labels:
          instance: 'port_status'
          group: 'port'
    relabel_configs:
    - source_labels: [__address__]
      target_label: __param_target
    - source_labels: [__param_target]
      target_label: instance
    - target_label: __address__
        replacement: 172.16.88.20:9115
#API Serevr节点发现
[root@centos prometheus]# systemctl restart prometheus.service
Grafana模板
可在官网查找blackbox_exporter相关的模板:
https://grafana.com/grafana/dashboards/
推荐模板ID:9965, 13587
配置告警
创建告警规则
vim rules/blackbox_rules.yml
groups:
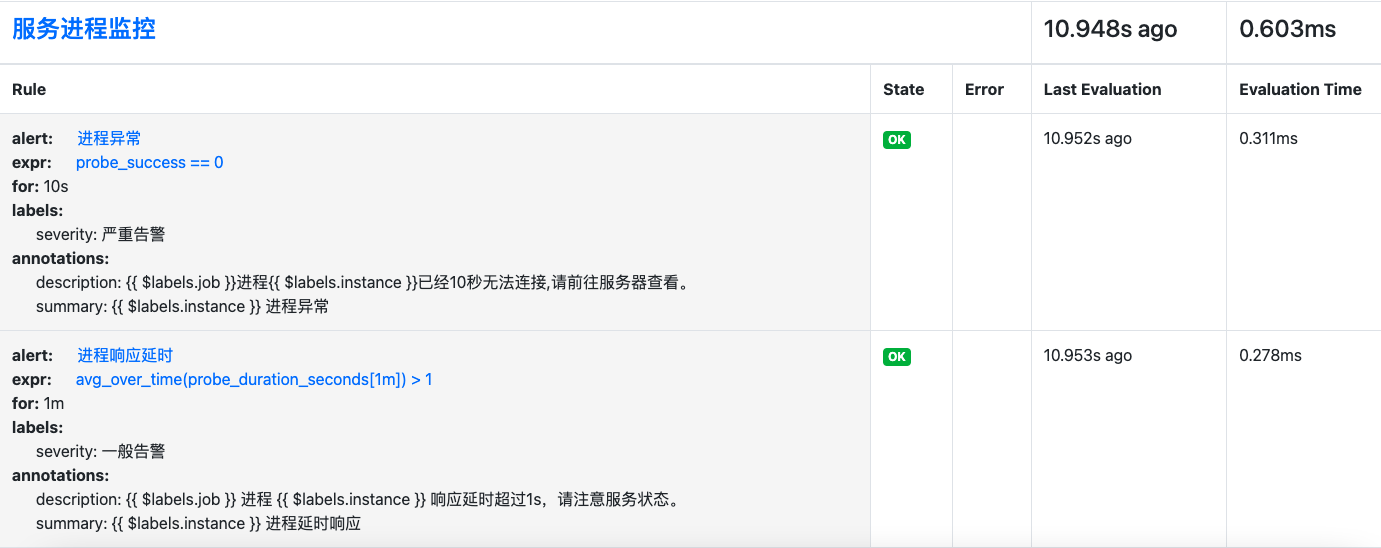
- name: 服务进程监控
rules:
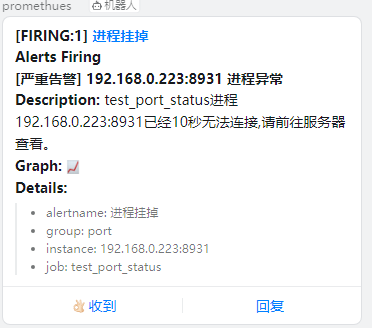
- alert: 进程异常
expr: probe_success == 0
for: 10s # 告警持续时间,超过这个时间才会发送给alertmanager
labels:
severity: 严重告警
annotations:
summary: "{{ $labels.instance }} 进程异常"
description: "{{ $labels.job }}进程{{ $labels.instance }}已经10秒无法连接,请前往服务器查看。"
- alert: 进程响应延时
expr: avg_over_time(probe_duration_seconds[1m]) > 1
for: 1m
labels:
severity: 一般告警
annotations:
summary: "{{ $labels.instance }} 进程延时响应"
description: "{{ $labels.job }} 进程 {{ $labels.instance }} 响应延时超过1s,请注意服务状态。"
- alert: 证书过期提醒
expr: (probe_ssl_earliest_cert_expiry -time())/3600/24 < 10
for: 600m
labels:
severity: 一般告警
annotations:
summary: "{{ $labels.instance }} 证书有效期不足10天"
description: "{{ $labels.job }} 网站 {{ $labels.url }} 证书即将过期,请注意续期证书,证书将在{{ $value }}天后过期。"
- alert: BlackboxProbeHttpFailure
expr: probe_http_status_code <= 199 OR probe_http_status_code >= 400
for: 0m
labels:
severity: critical
annotations:
summary: Blackbox probe HTTP failure (instance {{ $labels.instance }})
description: "HTTP status code is not 200-399\n VALUE = {{ $value }}\n LABELS = {{ $labels }}"
# Blackbox probe slow HTTP
- alert: BlackboxProbeSlowHttp
expr: avg_over_time(probe_http_duration_seconds[1m]) > 1
for: 1m
labels:
severity: warning
annotations:
summary: Blackbox probe slow HTTP (instance {{ $labels.instance }})
description: "HTTP request took more than 1s\n VALUE = {{ $value }}\n LABELS = {{ $labels }}"
# Blackbox probe slow ping
- alert: BlackboxProbeSlowPing
expr: avg_over_time(probe_icmp_duration_seconds[1m]) > 1
for: 1m
labels:
severity: warning
annotations:
summary: Blackbox probe slow ping (instance {{ $labels.instance }})
description: "Blackbox ping took more than 1s\n VALUE = {{ $value }}\n LABELS = {{ $labels }}"
prometheus配置添加告警rules
vim prometheus.yaml
# Load rules once and periodically evaluate them according to the global 'evaluation_interval'.
rule_files:
  # - "first_rules.yml"
  # - "second_rules.yml"
  - "./rules/blackbox_rules.yml"
重载prometheus服务。
systemctl restart prometheus.service
查看:
测试:
完成。
评论区